Ethereum at $2,300: A Textbook Oversold Reversal Setup
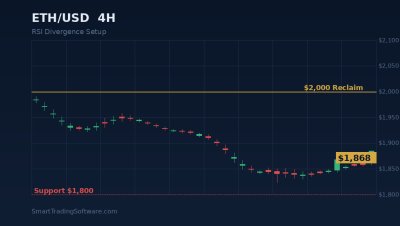
Ethereum is testing one of the cleanest technical setups of the spring trading season. After sliding from $2,417 last week to a current quote near $2,300, ETH is sitting on a key support cluster between the 78.6% Fibonacci retracement at $2,308 and the psychological $2,300 level. The 14-day RSI has dropped to 35.05, knocking on the door of oversold territory while the MACD is still printing a negative histogram.
This combination — price at deep support, momentum stretched to the downside, and volume that has dried up rather than expanded — is exactly the profile that mean-reversion strategies look for. The question is no longer whether ETH is cheap; it is whether the buyers can defend $2,200 long enough to engineer a push back into the $2,350–$2,400 supply zone.
The Strategy: Trading the RSI Divergence Bounce
The cleanest way to trade an oversold support test is to wait for confirmation rather than catch the falling knife. A bullish RSI divergence — where price prints an equal or lower low while the RSI prints a higher low — is the classical buy trigger in this kind of structure. With ETH currently at $2,300 and RSI at 35, the next dip toward $2,250–$2,275 would be the prime divergence window.
Entry Trigger
Wait for ETH to retest the $2,200–$2,275 support band on lower volume than the previous decline. Confirmation comes from a 4-hour candle closing back above $2,308 (the 78.6% Fibonacci level) while the RSI prints a higher low versus the previous trough. A clean close above $2,330 on rising volume is the aggressive entry; the conservative entry waits for a daily close above $2,350.
Stop Loss
Place the protective stop just below the $2,200 structural support — a reasonable level is $2,178, which gives the trade enough room to absorb noise around the $2,200 round number while still defining the invalidation point. A daily close under $2,200 voids the bullish thesis and opens the door to the $2,000 psychological level.
Take-Profit Targets
The first take-profit is $2,400, which aligns with the upper bound of the immediate resistance band and the 21-day EMA. Scaling out one third of the position at this level is sensible. The second target sits at $2,500, where the 50-day moving average currently caps price action. The runner can be left to ride toward $2,600–$2,800 if the broader market regains its bid.
Why Automation Outperforms Manual Trading on This Setup
Oversold reversal trades fail more often because of execution mistakes than because of bad analysis. Traders hesitate when price is falling, then chase when the bounce is already two candles old. Automated systems remove that emotional drag by reacting the moment the technical conditions align.
The RSI Divergence Bot is built specifically for this scenario. It scans for hidden and regular bullish divergences across multiple timeframes, places a market order the moment confirmation prints, and manages the trailing stop without the trader having to watch the chart. For the ETH setup described above, the bot can be configured to trigger only when both the 1-hour and 4-hour RSIs simultaneously print a higher low — a filter that dramatically improves the win rate on noisy crypto charts.
Traders who prefer to add a second confirmation layer often pair the divergence engine with the Support & Resistance Bot, which only allows entries near pre-mapped horizontal levels. With ETH bouncing inside a tightly defined $2,200–$2,400 corridor, the support/resistance filter prevents trades from firing in the middle of the range where reward-to-risk is thin.
Key Levels to Watch This Week
A handful of price points will define the next 5–7 sessions for ETH. Below $2,200, structure breaks down and the path of least resistance shifts to $2,000 — that is the line that bulls cannot afford to lose. The $2,308 Fibonacci level is the line in the sand on intraday charts; reclaiming it on volume is the first hint that buyers are stepping in. Above, $2,350 caps every short squeeze attempt, and only a clean daily close beyond it puts $2,400–$2,500 back on the menu.
Volume confirmation is essential. The current decline has come on muted participation, which means the market is more vulnerable to a short squeeze than the price chart alone would suggest. A surprise volume spike on a green candle should be treated as the first real sign that the bottom is in.
Backtesting Before You Deploy
Before running any strategy on live capital it is worth validating the parameters on historical data. The Indicators Tester lets you replay the last 12 months of ETH price action with adjustable RSI thresholds, divergence sensitivity, and stop placement. Most users find that lifting the divergence confirmation requirement to a minimum 8-bar separation between RSI lows filters out the false signals that plagued the choppy March consolidation.
Getting Started With the ETH RSI Divergence Setup
Putting the trade plan into action takes only a few minutes once your MetaTrader account is connected:
- Install the RSI Divergence Bot on your MT4 or MT5 platform and attach it to the ETH/USD chart.
- Set the timeframe filter to require divergence confirmation on both H1 and H4 charts simultaneously.
- Configure the support zone parameter to the $2,200–$2,308 band so the bot only fires inside the high-probability region.
- Run a 30-day forward test on a demo account using the Indicators Tester to confirm the parameter set behaves as expected on current ETH volatility.
- Enable a maximum daily loss cap of 2% to keep risk bounded if the $2,200 support fails on a surprise news event.
Crypto markets do not wait for hesitant traders. If you would like help configuring the divergence parameters for ETH or another instrument, the team is available through the contact page and typically replies within one business day.