Bitcoin Compresses Inside the $76K-$78K Range as April 2026 Closes
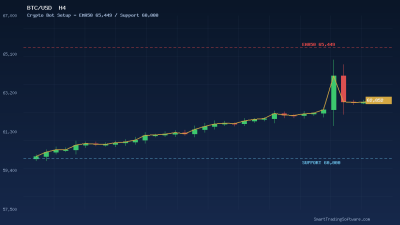
Bitcoin (BTC/USD) is trading near $76,500 as the final days of April 2026 unfold, slipping back from the $77,800 swing print that capped buyers earlier in the week. After rejecting the $80,000 psychological barrier twice this month, price has settled into a tight $76,000-$78,000 consolidation zone that traders are now treating as the launch pad for the next directional move.
The macro backdrop is nuanced. Bitcoin is down roughly 18.7% over the trailing twelve months, but the daily structure tells a more constructive story: the 14-day RSI is hovering around 60, signalling momentum without overbought stretch, and the price remains above the short and mid-term moving averages that have acted as a sloping base since the early-April lows. That combination - a flat range over a rising mean - is the textbook coil that automated breakout systems are designed to capture.
For traders running the Crypto Bot on MetaTrader 4 or 5, this is exactly the type of asymmetric setup the system was built for: a defined ceiling at $78,000-$79,000, a defended floor near $74,300, and enough volatility inside the box to extract repeated swings while waiting for the cleaner break.
Why the $78,000 Break Matters for the Next Month
The $78,000 level has rejected price three times since the April 11 low near $72,978. That cluster sits directly on the descending trendline that has capped every rally since the February top. A daily close above $78,000 would invalidate the bear channel, open the road back to the $80,786 R2 pivot, and put the $80,000-$82,000 supply pocket back in play. A failure here, on the other hand, swings the bias back to the $74,300 support shelf and ultimately the 100-day SMA near $72,978 - a level analysts increasingly cite as the line that decides whether April's drop is a flush or the start of a deeper retest of the $69,728 pivot.
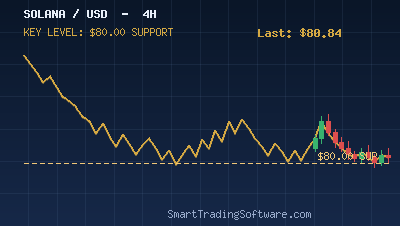
The Setup: Range Play With Breakout Conversion
The cleanest framework for this market is a two-part plan that scales into the eventual break rather than guessing at it:
Phase 1 - Range Trade
Buy intraday weakness toward $76,000-$76,200 with a stop just below $75,400. Take partial profits at $77,400 and trail the rest toward $78,000. The Crypto Bot's adaptive grid logic handles this without needing a discretionary trader at the screen, and its volatility filter automatically reduces position size when the daily ATR expands beyond a configurable threshold.
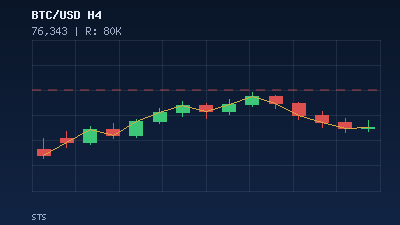
Phase 2 - Breakout Conversion
If the bot exits the range trade at $78,000 and price closes above the level on the H4 timeframe, the same engine flips into momentum mode: long entry on the retest of $78,000, stop under $77,200, first target $79,800, second target $80,786, runner toward $82,500. The dual mode is what separates the Crypto Bot from single-strategy systems that get whipsawed when the regime changes.
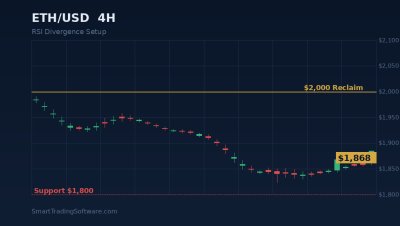
Confluence From RSI Divergence and Moving-Average Distance
The reason this setup is more than a coin flip is the indicator confluence sitting underneath it. The 14-period RSI on the daily chart printed a higher low on April 22 even as price tagged a lower low into $76,200 - a textbook bullish RSI divergence. Pairing that with the MA Distance Indicator shows price has now closed eight consecutive sessions within 1.5% of the 50-day moving average, the tightest compression since February's accumulation phase that preceded a 14% rally.
Tight MA distance plus stable RSI plus a defined range is the same fingerprint that preceded the late-March move from $74,000 to $79,000. Whether you trade discretionarily or with automation, monitoring those three readings is far more useful than chasing every $500 candle inside the box.
Why Automation Has the Edge in a Coiled Market
Range markets punish manual traders for two reasons: most setups occur during the Asian or European session when retail traders are away from the screen, and the temptation to widen stops or chase late entries is strongest exactly when liquidity is thinnest. The Crypto Bot sidesteps both problems by executing pre-defined rules around the clock, sizing each entry against current volatility, and refusing trades when the spread widens beyond a tolerance you set.
Before deploying live capital, the Indicators Tester lets you replay the bot's logic against the actual BTC/USD tick data from the past several months, including the recent $80K rejection and the April 11 flush. Walk-forward testing across the last 90 days of Bitcoin tape reveals exactly how the strategy behaves in the current volatility regime - not in some idealised backtest from 2021 when implied volatility was three times higher.
Levels to Watch Through Early May
Resistance ladder above price: $77,400 (intraday cap), $78,000 (range top and trendline), $79,000 (April high), $80,786 (R2 pivot), $82,500 (April supply pocket).
Support ladder below price: $76,000 (range floor), $75,400 (last week's low), $74,300 (key short-term shelf), $72,978 (100-day SMA), $70,000 (psychological line and S2 pivot).
The 24-hour volume sitting near $14.5 billion is roughly average for the last fortnight - neither the surge that confirms breakouts nor the collapse that signals exhaustion. Watch for a volume expansion of 30% or more above that baseline as the tell that one side is finally taking control of the range.
Getting Started With the Setup
The fastest path from analysis to execution looks like this:
1. Install the Crypto Bot on your MetaTrader 4 or MetaTrader 5 terminal and attach it to a BTC/USD chart on the H1 or H4 timeframe.
2. Configure the range parameters: upper bound $78,000, lower bound $76,000, ATR-based dynamic stop, and the breakout conversion module enabled.
3. Drop the MA Distance Indicator on the same chart so you can see at a glance when the compression starts to release.
4. Run the configuration through the Indicators Tester against the last 60-90 days of data before going live, and verify the equity curve survives the April 11 flush without breaching your maximum drawdown tolerance.
5. Start small. Even a winning system needs three or four trades to prove the regime is what you think it is.
Bitcoin's $76,000-$78,000 cage will not last forever - the longer it tightens, the more violent the eventual break tends to be. If you want help selecting the right Smart Trading Software product for your account size, time zone, and risk profile, the team is one click away on the contact page and typically responds within a business day.