Ethereum Tests the 50-Day Moving Average Near $2,126
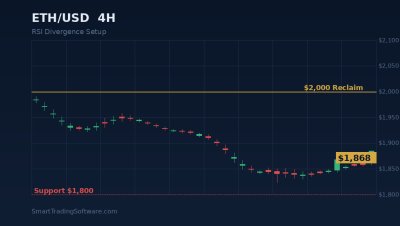
Ethereum is trading at $2,197.12 as of April 13, 2026, after a two-week correction that pushed price into a tight cluster between the 50-day and 200-day moving averages. The 50-day MA sits at $2,126.75, the 200-day MA at $2,128.07, and the two lines have essentially converged below current price. That convergence is rare, and traders should take it seriously: when the two most-watched moving averages stack on top of each other inside a few dollars, the market is telling you a decision point is close.
The 14-day RSI has cooled to 39.07, which is close to oversold territory without being extreme. The MACD is still negative at -84.58, reflecting the weakness of the last several sessions, but the weekly chart has printed a bullish engulfing candle that suggests buyers are starting to defend the $2,100 zone. Immediate support sits between $2,106 and $2,176. A clean hold above $2,100 opens the door toward $2,140 in the short term and $2,350 if momentum shifts. A break below $2,060 would invalidate the setup and put $1,950 back on the table.
Trading the Bounce: A Moving Average Reversion Strategy
The setup we want is classic mean reversion against a strong structural floor. Ethereum has spent most of 2026 trading above its 200-day MA, and the current pullback is the first meaningful test of that line in more than seven weeks. Historically, first touches of the 200-day MA in a bullish regime produce a bounce of at least 6-8 percent before the market reassesses. That projects a move from $2,197 to roughly $2,350-$2,400 if the pattern holds.
Entry Parameters
Wait for confirmation rather than anticipating the bounce. A valid entry is a 4-hour close back above $2,200 after price has tagged the $2,126-$2,140 zone. An aggressive alternative is to scale in with 50 percent of the position between $2,140 and $2,160, then add the remaining 50 percent once the 4-hour candle closes above $2,200.
Stop Loss and Take Profit
Place the stop just below $2,060, which sits under both moving averages and under the weekly swing low. That gives roughly 130-140 points of risk from a $2,197 entry. The first take-profit target is $2,350, where the 10-day MA at $2,661 starts to exert gravitational pull from above and where prior supply formed in late March. The secondary target is $2,586, the next major horizontal level on the daily chart. Using a $2,060 stop and a $2,350 first target, the reward-to-risk ratio is better than 1.1 to 1, and scaling out into $2,586 pushes it past 2.8 to 1.
Position Sizing
Risk no more than 1 percent of account equity on the initial entry. Because the 50-day and 200-day MAs are stacked so closely, a decisive break below $2,126 on volume is the kind of failure that can cascade quickly, and you want to be stopped out small rather than large.
Why Automation Matters for This Setup
The Ethereum reversion trade looks simple on paper, but the execution is where most discretionary traders lose the edge. The bounce from the 200-day MA often happens in a single Asian session candle or during thin liquidity windows when spreads widen and manual entries slip. An automated Crypto Bot can monitor the $2,126-$2,140 zone around the clock, trigger entries only on the confirmed 4-hour close, and place the $2,060 stop without emotion. That kind of rules-based execution is the difference between capturing the bounce and watching it happen while you are asleep.
Traders who prefer a stricter mean-reversion logic can layer the RSI Divergence Bot on top. With RSI at 39 and the weekly bullish engulfing in play, a positive divergence print on the 4-hour chart would be a high-quality confirmation signal. The bot watches for that divergence automatically and only fires when price action and momentum agree.
Before committing live capital, run the setup through the Indicators Tester. Pull the last 18 months of ETHUSD data, set the entry rule to "4-hour close above $2,200 after touching the 50-day MA," and see how many times this pattern delivered a 1.5R or better outcome. Backtesting removes the guesswork from position sizing.
Key Levels to Watch This Week
The chart has a handful of levels that will decide direction over the next five to seven sessions:
Immediate support: $2,176 (minor), $2,126-$2,128 (50-day and 200-day MA convergence), $2,106 (April swing low), $2,060 (stop-loss level and weekly invalidation).
Immediate resistance: $2,200 (psychological and 4-hour confirmation trigger), $2,250 (consensus April target), $2,350 (first take-profit), $2,586 (major horizontal supply).
Invalidation: A daily close below $2,060 shifts the bias bearish and opens $1,950 and $1,870 as next downside targets. If that happens, stand aside and wait for the weekly chart to reset.
Getting Started with Automated Ethereum Trading
- Review the current ETH/USD 4-hour and daily charts on your MT4 or MT5 platform and confirm the $2,126-$2,128 moving average cluster is still intact.
- Download and install the Crypto Bot and configure the entry zone at $2,140-$2,200 with the $2,060 stop.
- Run a 6-month backtest using the Indicators Tester to validate the strategy on your broker's spread and commission structure.
- Deploy the bot on a demo account for at least 72 hours and confirm that signals trigger as expected during live market conditions.
- Move to live trading with 0.5 percent account risk per trade until you have logged at least ten executed signals.
- Re-evaluate position sizing only after the strategy has demonstrated a positive expectancy across a minimum of 20 trades.
Ethereum at the 50-day and 200-day moving average convergence is one of the cleaner crypto setups of the quarter, but disciplined execution is what separates a winning trade from a stopped-out one. If you want help integrating the Crypto Bot or the RSI Divergence Bot with your broker, reach out to our team and we will walk you through the configuration.