Bitcoin Holds the $80K Line as ETF Inflows Refuel the Rally
Bitcoin is trading near $81,286 in early May 2026, having reclaimed the $80,000 psychological level after a brief flush below $76,000 last week. The recovery has been backed by genuine institutional flow rather than just retail speculation: spot BTC ETFs registered roughly $629 million in net inflows on May 1 alone, and pulled in approximately $2.4 billion across April — nearly double March's $1.32 billion. BlackRock's IBIT now holds around 810,000 BTC valued near $62 billion, capturing more than 70% of recent flows.
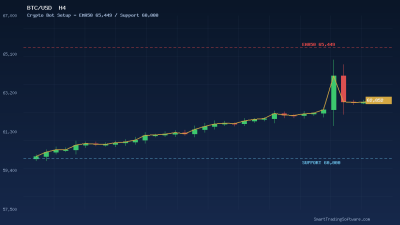
Macro context is mixed but supportive. The Federal Reserve held its policy rate at 3.50%-3.75% in late April with four dissents — the highest count since 1992 — which markets read as a hawkish pause rather than a hard stop. Bitcoin has so far absorbed that without breaking the higher-lows structure that has defined the trend since the early-April capitulation low. The chart now shows a textbook compression between $80,000 support and the $82,000-$85,000 supply pocket, and that is exactly the kind of setup an automated breakout strategy was built for.
The Setup: Range Compression Above Reclaimed Support
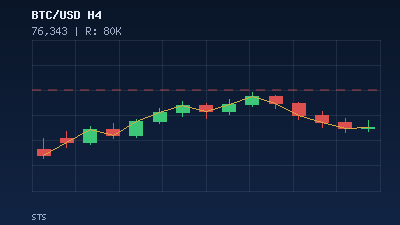
On the 4-hour chart BTC has carved out a tight range between roughly $79,800 and $82,200, with each test of the lower boundary producing a smaller wick than the previous one. That declining-volatility pattern, combined with a rising 50-period EMA now sitting near $80,400, is what traders look for ahead of an expansion move. A clean break above $82,300 with a closed candle and rising volume would open a measured-move target into the $85,000 area, where the prior March distribution sits as overhead supply. A failure and close back below $79,500 would invalidate the structure and put the $76,000 swing low back in play.
Entry, Stop, and Target Parameters
For a long-side automated setup the working parameters look like this: entry on a 4-hour close above $82,300, initial stop placed below the most recent swing low at $79,400 (a roughly $2,900 risk per BTC), and a first take-profit at $85,000 with a runner toward the $89,479 resistance noted by several technical desks as the next major uptrend test. A risk-to-reward of roughly 1:1.0 to the first target and 1:2.5 to the runner makes the setup viable even with a 50% strike rate, which is well within reach for a structured breakout system that filters out lower-volume false breaks.
What Invalidates the Trade
If price never reaches the $82,300 trigger and instead rolls over from inside the range, no trade fires — that is the discipline an automated executor enforces by design. A close back under $79,500 does more than stop out a long; it likely shifts the short-term bias to a retest of $76,000 and eventually the $75,109 bottom support flagged by the major technical models for May.
Why an Automated Crypto Bot Beats Manual Execution Here
Crypto markets do not respect screen time. The most decisive Bitcoin moves in the last six months have come during low-liquidity Asian sessions and during U.S. cash-equity gaps, which is precisely when most discretionary traders are away from the desk. An automated bot solves that by sitting on the order book 24/7, executing on the exact candle close that meets the entry rule rather than the candle close you happened to see. Our Crypto Bot is built around exactly this kind of confirmed-breakout logic and ships with adjustable filters for volume, ATR expansion, and session windows so you can tune it to your risk profile.
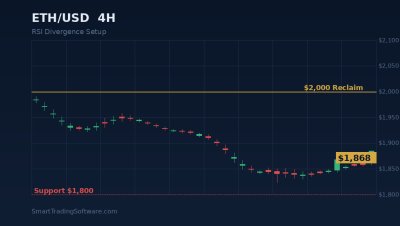
For traders who prefer to trade the reversal side of the same range — buying weakness at $79,500 or fading strength at $82,200 — the RSI Divergence Bot is a cleaner fit. It looks for hidden and regular divergences on RSI against price extremes, which is statistically the higher-probability play inside a defined range before a breakout actually triggers. A common workflow is to run the divergence bot intraday during compression and then let the breakout-style Crypto Bot take over once the range resolves.
Key Levels to Watch on Bitcoin Right Now
The map for the next two weeks is unusually clean. Immediate resistance sits at $82,300, which is the upper edge of the current 4H range. Above that, $85,000 is the prior distribution shelf and the first realistic profit-take. The $89,479 level is the next major uptrend resistance flagged by quantitative models, and a decisive break there opens a path toward the $90K-$100K zone that bullish forecasts have been pointing to for the May-June window. On the downside, $80,000 is the psychological floor, $79,400 is the last protective swing, and $76,000 is the line where the broader uptrend would come into question. A sustained loss of $75,109 would be the structural break.
Getting Started with an Automated Bitcoin Setup
If you want to put this trade on without babysitting the chart, the workflow is straightforward:
- Pick the bot that matches your bias. For the breakout play above $82,300, install the Crypto Bot. For range-fade entries inside the $79.5K-$82.3K box, use the RSI Divergence Bot.
- Backtest your chosen parameters against the last 90 days of BTC/USD data using the Indicators Tester. The April flush below $76K and the subsequent reclaim of $80K give you a representative sample of both range and trend conditions.
- Reduce position size by half for the first live week. Confirmed breakout systems work, but every market regime has its own rhythm and the early sample lets the bot calibrate without putting full risk at stake.
- Layer in the Support & Resistance Bot as an overlay. It marks the $80K, $82.3K, $85K, and $89.5K zones automatically and can act as a second filter on entries.
Need a hand sizing the setup, choosing between the breakout and range bots, or wiring everything into your MetaTrader 5 account? Reach out via the contact page and one of our analysts will walk you through it.