Bitcoin Tests the $75,000 100-Day Moving Average at Four-Week Highs
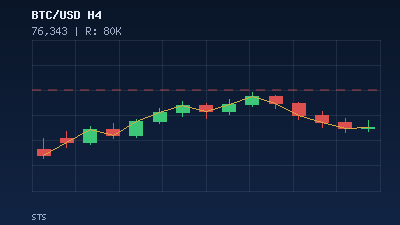
Bitcoin has pushed to four-week highs near $74,000, coiling just beneath the psychologically important $75,000 barrier that aligns almost perfectly with the 100-day moving average. The rally has carved out a well-defined range between $68,900 support and $73,868 resistance, with buyers defending the $70,000â$70,540 zone that overlaps the Alligator indicator's middle band. Daily RSI sits near 63 â building bullish momentum without venturing into overbought territory â and the MACD histogram is expanding to the upside. That is the textbook condition for a Renko breakout play, where noise gets filtered out and only genuine directional moves print new bricks.
The $80,000â$80,600 zone is the next meaningful supply shelf above $75K, and the 60Kâ65K region continues to act as the macro floor. With the daily Alligator coiled and volatility compressed, a Renko strategy calibrated to 500-point bricks gives traders a clean, auto-filtered view of the trend without getting chopped by every $1,000 intraday wiggle.
Why Renko Charts Work for Bitcoin at This Juncture
Renko bricks only print when price moves a fixed amount â in this case 500 USD â so sideways chop between $72,500 and $73,500 produces no new bricks at all. A confirmed break above $75,000 would require three consecutive green bricks stacking toward the 100-day MA, a high-conviction signal compared with a single candle poking above resistance. This is why Renko suits Bitcoin now: the 4%-5% upside projection into $74,500â$75,500 fits cleanly inside a 500-brick framework, and the 60Kâ65K macro support maps onto clear downside invalidation zones.
Entry Rules
Wait for three consecutive green Renko bricks printing above $74,500. Enter long on the close of the third brick, ideally with a daily RSI reading between 60 and 70 and MACD histogram still expanding. Avoid chasing if RSI pushes above 72 â the $75,000 MA zone can easily produce a two-brick rejection on first touch.
Stop Loss and Take Profit
Place the stop-loss two bricks below the entry brick, which typically lands around the $72,500â$73,000 pocket and keeps the trade's structure intact as long as the $70,540 Alligator support holds. First take-profit sits at $77,500 (50% of the position, roughly a 1.5R reward) with the runner trailed beneath each new brick toward the $80,000â$80,600 supply shelf. If the 200-day MA projection near $83,000 is tagged, close the remaining position into strength rather than holding through the weekend.
Automating the Setup with STS Tools
Renko strategies are uniquely well-suited to automation because their entry and exit conditions are mechanical â either a new brick prints or it doesn't. Manual traders frequently misread wicks and intrabar noise on standard candlesticks, but a bot reading Renko data has no such ambiguity. Our Renko Bot runs on MetaTrader 4 and 5, plugs directly into your broker's BTC/USD feed, and executes the three-brick confirmation rule without hesitation, slippage, or second-guessing.
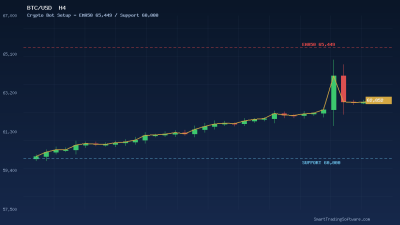
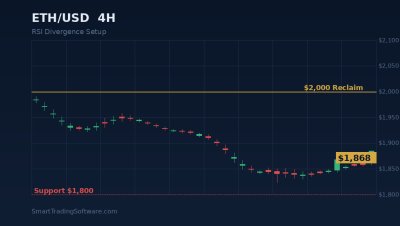
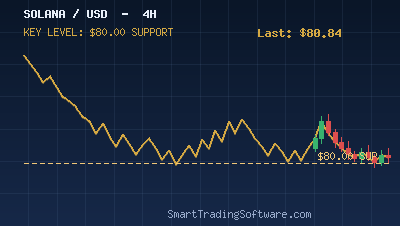
For traders who want an additional confirmation layer, the Crypto Bot combines momentum and volatility filters specifically tuned for BTC, ETH, and SOL, and the RSI Divergence Bot can act as an early-warning system if momentum starts to weaken ahead of the $75K test. Before committing real capital, run the parameters through our Indicators Tester on the last 180 days of BTC data to validate the 500-brick size against recent volatility regimes.
Key Levels to Watch This Week
The map is unusually clean right now. On the upside, $75,000 is the pivotal level â it's simultaneously a round number, the 100-day MA, and the upper lip of the current consolidation. A confirmed close above unlocks $77,500 and then the $80,000â$80,600 historical supply band. On the downside, $70,540 is the immediate line in the sand (Alligator band + recent daily low), with $68,900 as the range floor. A daily close below $68,900 would invalidate the bullish Renko structure and redirect focus to the 60Kâ65K macro support zone.
Watch the daily MACD for any bearish cross â if the histogram starts contracting while price stalls under $75K, that's often the tell that a rejection back to $70K is loading. The current RSI reading near 63 still has runway to 70 before overheating, giving the breakout roughly 2â3 more brick advances before momentum conditions tighten.
Getting Started with Automated Bitcoin Renko Trading
If the setup lines up with your risk tolerance, here is how to deploy it this week:
- Download and install the Renko Bot onto your MT4 or MT5 terminal.
- Configure the brick size to 500 USD and attach the bot to a BTC/USD chart on the daily timeframe.
- Set the entry filter to require three consecutive green bricks and a daily RSI above 60.
- Backtest the parameter set using the Indicators Tester on BTC data from January through April 2026.
- Run the bot on a demo account for 48 hours first, confirm fills and latency, then scale to live with position sizing that caps risk at 1% per trade.
Bitcoin's coiled structure under $75,000 is one of the cleanest mechanical setups of the quarter, but the edge disappears quickly if executed emotionally. Let the bricks do the filtering. If you need help configuring the bot for your specific broker feed or want a parameter review from our analysts, contact our team and we'll walk you through it.