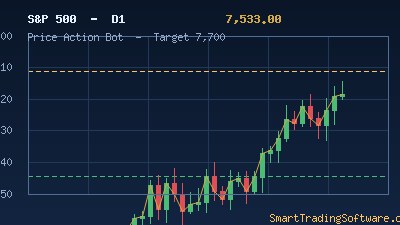
S&P 500 Near Record Highs: Watching the 7,230 Zone in Early May 2026
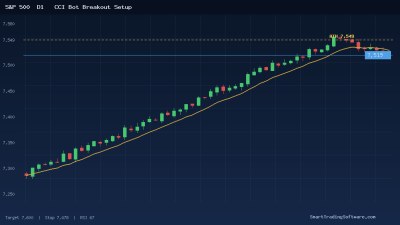
The S&P 500 has carried its bullish momentum into May, printing a fresh all-time high of 7,272.52 on May 1, 2026 before settling around the 7,230 area. The benchmark gained roughly 1.6% on that session as cooling oil prices and renewed strength in mega-cap tech, led by Apple, pushed buyers back into US equities. With RSI on the daily chart pushing well above 70, the index is now technically overbought, and several major analysts expect Q2 and Q3 to bring elevated volatility even if the longer-term trend remains intact.
From a structural standpoint, traders are now watching three specific zones. The first is 7,100–7,130, the prior consolidation top that has flipped into immediate support. Below that, the 6,780–6,720 area marks a deeper pivot where the trend would need to be re-evaluated. To the upside, the most cited extension target sits between 7,300 and 7,375, an area derived from the recent breakout measured move. For active traders, the cleanest setups in this kind of environment usually emerge from controlled pullbacks into demand rather than from chasing breakouts at stretched RSI readings.
The Pullback Strategy: Trading the 7,130 Reload
When an index is extended, mean reversion to the most recent breakout shelf is one of the highest probability setups available. The plan here is straightforward: wait for price to rotate down from the 7,230–7,272 zone toward 7,130, then look for a price action confirmation signal—an engulfing candle, a pin bar with rejection wick, or an inside-bar breakout in the buy direction. The thesis fails cleanly if the index loses 7,100 on a daily close, which would open the door to a deeper test of 6,780.
Entry, Stop and Target Parameters
For discretionary traders, a sample swing setup looks like this. Entry at 7,135 on a confirmed bullish reaction. Stop loss at 7,085, just under the 7,100 floor, giving the trade enough room to breathe through normal noise. First take profit at 7,230 (recent intraday resistance), second take profit at 7,300, and a trailed runner toward 7,375. That structure produces an initial reward-to-risk ratio of close to 2:1 on the first target alone, and stretches well beyond 4:1 if the breakout extension plays out.
Filters That Increase the Edge
Two filters meaningfully improve this kind of pullback play. The first is a volume condition: the rejection candle at 7,130 should print on rising volume relative to the prior session, signaling fresh buyers stepping in. The second is a higher-timeframe alignment check—the weekly trend should still be making higher lows, and the daily 50-period moving average should remain below the current price. If either condition breaks down, the setup is best skipped.
Why Automation Matters at All-Time Highs
Trading near record highs is psychologically difficult. FOMO pulls traders into chasing extended moves, and fear pulls them out of valid pullback entries when the tape gets choppy. Algorithmic execution removes both problems. A rules-based system enters when the conditions hit and not a tick before, sizes the position according to a fixed risk percentage, and exits exactly where the plan said it would—regardless of how the trader feels about the headlines that day.
For an index like the S&P 500, where intraday gyrations can be sharp around US economic data and Fed commentary, this kind of disciplined execution often makes the difference between a profitable month and a flat one. Pre-defined rules also make it possible to backtest the approach across years of data so you know what kind of drawdown and win rate to expect before risking real capital.
Current Levels to Watch on the S&P 500
Here are the key technical reference points for the days ahead. Immediate resistance is at 7,272 (the May 1 all-time high), followed by 7,300 and the extension target of 7,375. Immediate support sits at 7,130, with stronger demand at 6,780. A daily close above 7,300 would confirm continuation toward the 7,375–7,500 zone; a daily close below 7,100 would shift the bias to neutral and put 6,780 in play. Watch the RSI as well—a bearish divergence forming on the daily, where price prints higher highs while RSI prints lower highs, would be the earliest warning that the pullback is about to begin.
Getting Started with the Setup
Here is a practical four-step plan to put this idea into action this week.
- Validate the strategy on past breakouts in the S&P 500 using Indicators Tester, which lets you replay historical setups bar by bar and confirm that the pullback-to-support pattern has produced acceptable win rates and drawdowns on the index.
- Automate the execution with Price Action Bot, designed to detect engulfing candles, pin bars and inside bars at user-defined support and resistance zones and to trigger entries with proper risk-managed orders.
- Add a higher-timeframe trend filter using Trend Lines Bot so that pullback entries are only taken in the direction of the dominant trend on the daily and weekly charts, exactly as the S&P 500 setup requires today.
- Layer a momentum confirmation on top with RSI Divergence Bot, which will warn you the moment momentum starts decoupling from price—useful both as an early exit signal on long trades and as a re-entry trigger if a deeper retest of 6,780 develops.
If you want help configuring any of these tools for your S&P 500 strategy, or you would like a walkthrough of how to combine them on a single MT5 chart, reach out via our contact page and our team will guide you through the setup.