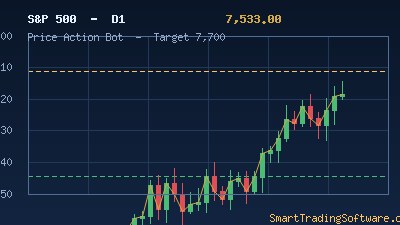
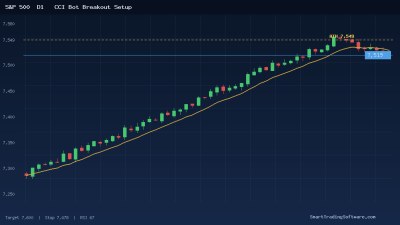
S&P 500 Holds 7,138 as Bulls Eye the 7,200–7,300 Resistance Band
The S&P 500 index closed at 7,137.90 on April 29, 2026, bouncing 1.05% (+73.89 points) and consolidating just below its all-time intraday high of 7,168.59 printed on April 24. After a tense Q1 that saw the index whip between 6,500 and 6,700, momentum has flipped decisively bullish, with the broad index up roughly 29% year-on-year and pressing against a well-watched supply zone between 7,200 and 7,300. Forecasters at major desks now see a tradeable range of 7,100–7,300 into the first week of May, with bulls targeting 7,375 on a clean weekly close above 7,200 and bears defending the 7,014/6,780 confluence on any pullback.
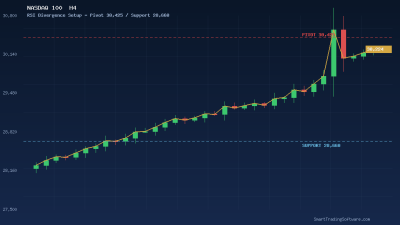
The technical structure flipped from bearish to neutral the moment the index reclaimed 6,700 on a weekly basis earlier this month — a level Evercore and other strategists had flagged as the line in the sand. Now that 6,700 has become support, the path of least resistance is higher, but momentum studies are flashing the kind of subtle warnings that disciplined traders take seriously: bearish RSI divergence on the 4-hour and daily charts, with price making higher highs while the 14-period RSI quietly carves lower peaks below 70. That divergence pattern is exactly what the RSI Divergence Bot is engineered to detect, score, and trade automatically.
Why the 7,200–7,300 Zone Is the Key Battleground
Three independent technical reasons make 7,200–7,300 the most important resistance band on the chart right now. First, it is the 161.8% Fibonacci extension of the January-to-March correction, which acts as a natural profit-taking magnet for swing traders. Second, the 200-period exponential moving average on the 1-hour chart sits inside this zone, providing dynamic resistance that algorithmic systems lean against. Third, the upper Bollinger Band on the daily timeframe (2.0 standard deviations) currently overlaps with 7,212, meaning any sharp push into this area will print statistically extended conditions on multiple horizons simultaneously.
Historically, when the S&P 500 enters a confluence like this with a stretched 14-day RSI above 68 and a bearish divergence already in place on the 4-hour chart, the probability of an immediate vertical breakout is below 35%. A more common outcome is a 1.5%–2.5% pullback to retest the 7,014 pivot or the 7,000 round number, followed by a fresh leg that resolves the divergence and only then breaks 7,300 with conviction.
Trade Setup: Sell the Divergence, Buy the Retest
The cleanest playbook here is a two-stage strategy. Stage one is a short-side scalp on the first confirmed bearish RSI divergence into the 7,200–7,250 zone, with a tight stop above 7,310 and a primary take-profit at 7,070–7,015. Stage two is the swing long: when price pulls back into the 7,000–7,015 demand zone and the 14-period RSI prints a bullish divergence on the 4-hour chart, that is the institutional re-entry trigger for a push toward 7,375 and ultimately 7,500.
Specific Parameters for the Short Setup
Entry: 7,205–7,245 on confirmed bearish RSI divergence (price prints a higher high while RSI prints a lower high, both above 65).
Stop loss: 7,312 (just above the round-number resistance and the upper Bollinger Band).
Take profit 1: 7,070 (1:2 reward-to-risk).
Take profit 2: 7,015 (1:3 reward-to-risk and the prior breakout pivot).
Position size: risk no more than 0.75% of account equity given the index is in a structurally bullish trend.
Specific Parameters for the Long Re-Entry
Entry: 7,000–7,015 on bullish RSI divergence on the 4-hour chart.
Stop loss: 6,955 (below the recent swing low and the 50-period EMA on the daily).
Take profit 1: 7,200 (1:3 reward-to-risk).
Take profit 2: 7,375 (1:6 reward-to-risk — the bullish year-end target).
Why Automation Beats Manual Execution Here
RSI divergences are deceptively hard to trade by hand. The signal looks obvious on a static chart, but in real time you are watching two oscillators move tick by tick across multiple timeframes, and the human eye routinely misses cleaner setups while overreacting to noisy ones. An automated system removes the guesswork. The RSI Divergence Bot scans for both regular and hidden divergences, scores each pattern on its quality (slope, depth, confirmation candles), and only fires when the configured threshold is crossed — which means you are not chasing every wiggle, only the highest-probability ones.
For traders who prefer to stay in the cockpit but want a sharper read, the MA Distance Indicator measures how far price has stretched from key moving averages and flags overextension in real time, which is exactly the warning sign you want when the index is grinding into 7,250 with the 14-day RSI above 70. Pairing a divergence trigger with an extension filter dramatically reduces false positives during strong trends.
Key Levels to Watch This Week
Resistance: 7,168 (recent ATH), 7,205 (initial supply), 7,300 (psychological round number and bull target invalidation), 7,375 (extended target).
Support: 7,070 (10-day EMA), 7,015 (prior breakout pivot), 6,950 (50-day EMA confluence), 6,780 (gap fill and weekly support), 6,700 (the bull/bear line in the sand).
Bias scenarios: a daily close above 7,205 with RSI above 68 unlocks a fast move to 7,300; failure at 7,205 with bearish divergence intact opens the door to a 7,015 retest; a weekly close back below 6,950 would re-introduce the bearish thesis and target 6,780–6,720.
Getting Started With the RSI Divergence Bot on the S&P 500
If you want to deploy this strategy without babysitting the screen, the workflow is straightforward.
1. Backtest the configuration on US500/SPX500 CFD data using the Indicators Tester to confirm the divergence threshold and timeframe combination that worked best on your broker's data feed for Q1 2026.
2. Install the RSI Divergence Bot on a MetaTrader 5 chart of US500 set to the H4 or H1 timeframe.
3. Configure the bot to take only A-grade divergence signals, with the stop and take-profit levels listed above as fixed parameters initially, then enable trailing once price clears the first target.
4. Run a small live position size for the first two weeks to validate execution and slippage on your broker before scaling up.
5. Layer the MA Distance Indicator on the same chart to filter out signals that fire when the index is already overextended in the direction the bot wants to trade.
The S&P 500 has a clear structure right now: bullish above 6,950, supply-heavy at 7,200–7,300, and a momentum picture that favors patient, signal-based execution over chasing breakouts. If you want help wiring this setup into your existing MetaTrader workflow, our team is happy to walk through the configuration with you — contact us here and we will get back to you the same business day.