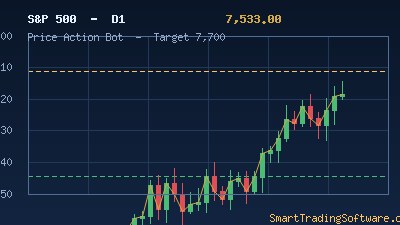
S&P 500 at 6,890: Navigating the Death Cross with MA Distance Signals
The S&P 500 begins the second week of April 2026 trading at approximately $6,890, caught in a delicate balancing act roughly 1.7% below the all-time high of $7,008 set on January 28. The index is consolidating inside a narrow band after a volatile first quarter that saw escalating geopolitical tensions and a renewed inflation battle push benchmark US equities into one of the most technically interesting setups of the year. What makes the current moment stand out is the confirmed Death Cross: the 50-day moving average at 6,783.63 crossed below the 200-day moving average at 6,644.60 in late March, and the index now trades above both lines while attempting to reclaim lost momentum.
RSI sits near 46.2, reflecting an indecisive market that is neither oversold nor overbought. This is exactly the kind of environment where moving-average distance strategies and disciplined support/resistance trading tend to outperform momentum chasing. Traders who systematize these signals — rather than react emotionally to headlines — are best positioned for the next directional move.
Why the MA Distance Strategy Shines After a Death Cross
A Death Cross on a major index does not guarantee a crash. What it does signal is a regime shift where mean-reversion to the slower moving average becomes statistically more likely, and rallies into the faster moving average attract systematic selling from trend-following algorithms. The MA Distance indicator measures the exact percentage gap between price and a chosen moving average, turning a subjective chart observation into a clear, quantifiable signal.
With the S&P 500 at 6,890 and the 50-day MA at 6,783.63, price currently sits roughly 1.57% above the fast MA — a stretched condition that historically precedes pullbacks toward 6,780–6,720 when the broader structure remains fragile. A close back below 6,783 would flip the bias toward retesting the 200-day MA at 6,644 and the psychological 6,500 support. Conversely, sustained distance above 6,900 with the 50-day MA flattening would argue for a resumed drive into the 7,000–7,132 resistance zone.
Entry Parameters
For short setups from resistance, look for price rejection in the 6,920–6,950 zone, confirmed by the MA Distance indicator reading above +2.0% versus the 50-day MA combined with bearish price action such as a lower high or bearish engulfing bar on the 4-hour chart. For long reversion trades, wait for price to pull back to the 6,780–6,720 zone with MA Distance compressing below +0.3% and RSI on the 4-hour chart lifting from sub-40 readings.
Stop Loss and Take Profit
Short entries near 6,940 should place the stop above the April swing high near 6,980 — a risk of roughly 40 points — with the first target at 6,800 and the extended target at 6,720 for a reward-to-risk ratio close to 3.5:1. Long entries near 6,760 should protect below the 200-day MA area at 6,620, with the first target at 6,880 and the extended target at 6,960. Size positions so that a full stop-out risks no more than 0.75% of account equity given current volatility.
Why Automation Beats Manual Execution Here
The S&P 500 rarely sits still long enough for discretionary traders to catch every MA interaction cleanly, especially during the US cash session when liquidity shifts rapidly between index futures and cash. Automating the execution of a moving-average distance strategy removes the hesitation that typically plagues traders staring at a chop chart near the 50-day MA.
The MA Distance Indicator (€25) plots the exact gap between price and any selected moving average, making extremes visible in real time and giving a rules-based edge when combined with price action. To systematize the entry logic on US indices, the Trend Lines Bot (€350) automatically identifies moving-average slopes and trend structures, then executes trades according to your parameters without emotional interference.
Before committing capital to a live setup, backtesting against real S&P 500 tick data is essential. The Indicators Tester (€155) lets you replay months of historical price action and measure exactly how the MA distance strategy would have performed through the January highs, the March Death Cross formation, and the current consolidation — so you deploy with conviction rather than hope.
Key Levels to Watch This Week
On the upside, 6,920 is the immediate resistance where recent rallies have stalled, followed by 7,000 as a major psychological and options-flow barrier, then 7,132 as the measured-move projection from the post-Death-Cross bounce. A weekly close above 7,000 would neutralize the Death Cross signal and shift focus back toward the 7,375 zone cited by several institutional desks as the next structural target.
On the downside, 6,783 is the 50-day MA and acts as pivot support; below it, 6,720 is the first reaction target where mean-reversion buyers have historically stepped in. A decisive break below 6,644 (the 200-day MA) would open the path to 6,500 as psychological support and 6,400 as the key structural floor. A daily close below 6,400 would complete a larger distribution pattern and project a Fibonacci retracement target near 6,170, aligning with Goldman Sachs' warning scenario if energy prices remain elevated.
Getting Started With This Setup
- Attach the MA Distance Indicator to your S&P 500 CFD or ES futures chart on the 4-hour timeframe, configured against the 50-day and 200-day moving averages.
- Mark the current structural levels on your chart: resistance at 6,920 / 7,000 / 7,132 and support at 6,783 / 6,720 / 6,644 / 6,500.
- Load the strategy into the Indicators Tester and run it across the last 180 days of S&P 500 data to validate your entry and exit parameters.
- Deploy the Trend Lines Bot on a demo account for at least two weeks, confirming that signal frequency and execution quality match your backtest before switching to a funded account.
- Monitor weekly for structural changes: if the 50-day MA curls upward and crosses back above the 200-day, adjust the bias toward long-only setups and tighten short-side risk parameters.
The combination of a confirmed Death Cross, compressed RSI readings, and clear horizontal structure makes the current S&P 500 environment one of the most trade-ready setups of 2026 so far. If you would like help matching an automated strategy to your broker, risk profile, or preferred timeframe, reach out to our team and we will walk you through the setup.