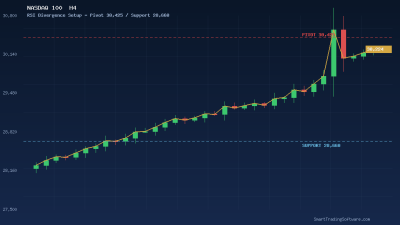
NASDAQ 100 Approaches 27,500 Resistance After Historic Rally
The NASDAQ 100 has powered into the second half of April 2026 trading near 27,180, just a stone's throw from the well-watched 27,500 resistance band. After clearing the 26,672 pivot earlier this month, the index has stretched its winning streak into double digits and now flirts with overbought territory on most momentum oscillators. The 14-day RSI is hovering above 72, the daily CCI has been pinned above +200 for three consecutive sessions, and price is trading roughly 5.4% above its 50-day moving average — a classic recipe for a short-term cooldown even within an intact uptrend.
What makes this technical picture interesting is the symmetry of the setup. Buyers are defending each shallow dip near 26,950, yet sellers are stepping in aggressively whenever the index pokes through 27,400. That tug-of-war has carved out a tight range with a clear ceiling, and it is exactly the kind of stretched, mean-reversion environment where a Commodity Channel Index strategy tends to shine. Traders who can recognise an exhausted impulse and fade it with disciplined risk management have a textbook opportunity to play, whether the next move is a 27,500 breakout or the long-overdue pullback toward 26,500.
The CCI Reversal Strategy for Overbought NASDAQ Conditions
The Commodity Channel Index, originally developed by Donald Lambert, is built specifically to flag price extremes. When CCI extends above +200 it tells us that price has stretched far from its statistical mean — a state that rarely persists for more than a few sessions. Pair that with a hard horizontal level like 27,500, and you have two independent reasons for the move to stall. The strategy below converts that confluence into a rule-based trade plan.
Entry Criteria
Wait for the NASDAQ 100 to print a daily candle that touches or pierces 27,500 while the CCI(20) reading is above +200. Confirmation comes on the close: if the candle finishes back below 27,450 with CCI rolling lower (i.e., a bearish hook), enter a short position on the open of the following session. A second valid trigger is an intraday H1 bearish engulfing pattern at the same zone, provided it lines up with negative CCI divergence on the 4-hour chart.
Stop Loss
Place the protective stop at 27,640, just above the secondary supply pocket from the early-April highs. That gives the trade roughly 190 points of breathing room and ensures a stop-out only if the breakout is genuine.
Take Profit Targets
The first take-profit sits at 27,000 — the round-number magnet and prior breakout level. The second, more ambitious target is 26,500, which aligns with both the 21-day exponential moving average and the volume-weighted value area from mid-April. That structure delivers a reward-to-risk profile of roughly 1:1 on TP1 and just over 3.5:1 on TP2, an acceptable asymmetry for a counter-trend trade.
Position Sizing
Because we are fading a strong trend, position size should remain conservative — usually 0.5% to 1% of account equity per trade. Splitting exposure into two tranches and trailing the stop to entry once price touches 27,000 is a sensible way to protect the second half of the position.
Why Automation Beats Manual Execution on Overbought Setups
Trading overbought reversals by hand is psychologically demanding. The market spends hours grinding higher before any pullback materialises, and discretionary traders frequently capitulate or chase the breakout at exactly the wrong moment. An automated system removes the hesitation. The CCI Bot continuously monitors the indicator across multiple timeframes, validates that the index is in our target zone, and only fires when every condition is met. No fatigue, no fear of missing out, no gut-feel overrides.
Before a strategy goes live, however, it has to earn its keep on history. The Indicators Tester lets you backtest CCI thresholds, look-back windows and confirmation filters across years of NASDAQ 100 tick data so you can pick parameters that actually survived past regimes — including the volatile stretches of late 2022 and early 2025. For traders who prefer a longer-term momentum filter to keep them on the right side of the larger trend, the MA Distance Indicator measures how stretched price is from any moving average, providing a clean visual signal of when the index is statistically too far from its mean.
Key Levels to Watch on the NASDAQ 100
The map for the next two weeks is reasonably clean. Above current price, 27,500 remains the obvious ceiling, with 27,800 and the 28,100 psychological round number waiting if buyers manage a clean break-and-hold. Below price, 27,000 is the first defended floor, followed by 26,500 (21-day EMA) and 26,000 (the multi-week structural pivot and the level that triggered the most recent leg higher). A daily close beneath 26,500 would invalidate the bullish channel and open the door to a deeper retracement toward 25,770 — the level highlighted by several institutional desks as their preferred re-entry zone.
One more variable worth tracking: Big Tech earnings are landing this week. Volatility expansion around those releases can cause overshoots in either direction, so any CCI signal that fires within three hours of an earnings print should be filtered out by default to avoid being run over by event-driven flow.
Getting Started With the NASDAQ CCI Strategy
Putting the plan into practice is straightforward. Follow the steps below and you can be running a properly tested CCI reversal system before the next NYSE open.
- Pull historical NASDAQ 100 data into MetaTrader 4 or 5 and run a backtest of the CCI threshold setup using the Indicators Tester. Compare results across 2022, 2024 and 2025 regimes.
- Lock in the CCI period (20 by default) and the +200 / -200 thresholds. Document the rules in a short trade plan you can refer back to.
- Deploy the CCI Bot on a demo account first. Set NASDAQ 100 as the working symbol and use the H4 timeframe for confirmation.
- Add the MA Distance Indicator as a secondary confluence filter — it stops the bot from shorting into trends that have not yet stretched far enough from the mean.
- Once two weeks of live demo signals match your backtest expectations, scale the system onto a small live allocation and let the data, not the emotion, decide each trade.
If you want a tailored configuration walk-through, our trading desk can review your account size, broker spreads and risk profile to fine-tune entry filters before going live. Drop us a note via the contact page and the team will be in touch within one business day.