XAU/USD Defends $4,700 as Strait of Hormuz Uncertainty Caps Gold's Upside
Gold is trading at $4,738.53 on April 24, 2026, after a choppy session that saw XAU/USD dip to $4,684.45 before rebounding back above the psychologically important $4,700 handle. The metal opened at $4,740.15 on Thursday and finished the day essentially flat, closing down just 0.02% as traders wrestled with a push-pull between safe-haven demand and a stronger US dollar that continues to dampen precious-metals bids.
The backdrop remains anything but calm. The ongoing blockage of the Strait of Hormuz has kept WTI crude pinned above $120 per barrel, feeding a renewed inflation narrative that would normally be rocket fuel for gold. Instead, the same inflation story has forced a more hawkish Fed repricing, lifting 2-year Treasury yields back toward 5.15% and giving the dollar index a floor around 108. Gold is now down roughly 10% from the early-year highs, yet it refuses to break the $4,645 structural support — and that failure to collapse is the single most interesting feature on the daily chart.
The Range Setup: Why $4,645 and $4,926 Matter
Looking at the H4 and daily time frames, XAU/USD has carved out a clean horizontal range. The lower boundary at $4,645.91 has been tested three times in the past two weeks, each time producing a visible rejection wick. The upper boundary sits at $4,926.13 — the April 9 swing high that coincides with the descending channel resistance off the March peak.
Between those two levels, price is oscillating inside what is effectively a 280-dollar corridor. The 14-day RSI is currently printing 41.27, which places it in the lower half of the band but clearly not in oversold territory. That reading tells you momentum is soft, but there is no extreme positioning yet — exactly the kind of environment where a disciplined range strategy outperforms trend-following approaches.
For traders, the edges of this range are the only levels that matter right now. Buying $4,645-$4,700 with a tight stop below $4,576, and selling $4,880-$4,926 with a stop above $4,996, is a textbook mean-reversion setup. The problem is execution: gold's intraday ranges have expanded to 60-80 dollars, and getting filled at the extremes requires round-the-clock monitoring that most retail traders simply cannot provide.
Automating the XAU/USD Range with the Gold Bot
This is where algorithmic execution earns its keep. The Gold Bot is built specifically for XAU/USD and uses a multi-factor confluence model that combines dynamic support/resistance detection, ATR-based volatility filtering, and a momentum confirmation layer to time entries at the edges of consolidation zones. Rather than reacting to every candle, the bot waits for price to enter a pre-defined reaction zone and only fires when RSI and ADX confirm that the range is still intact.
Suggested Parameters for the Current Gold Range
For the present $4,645-$4,926 corridor, a reasonable configuration looks like this:
Entry zones: Long bias activated on any touch of $4,645-$4,700. Short bias activated on any tag of $4,880-$4,926. The Gold Bot's Zone Width parameter controls how far inside each level the bot will start accumulating — 25 pips is a sensible default for a range this wide.
Stop loss: $55-$70 below the long entry zone ($4,576 absolute floor), and $70 above the short entry zone ($4,996 absolute ceiling). These stops deliberately sit beyond the most recent false-breakout wicks so that liquidity sweeps do not close the trade prematurely.
Take profit: Target 1 at the mid-range $4,785, target 2 at the opposite side of the band. Trailing stops should only engage once price has traveled more than 50% of the range.
Session filter: Restrict trading to London and New York overlap (13:00-17:00 GMT). Asian-session liquidity in gold has been notably thin during the Middle East conflict, and spreads widen enough to erode the edge.
Confirming Range Integrity with RSI Divergence
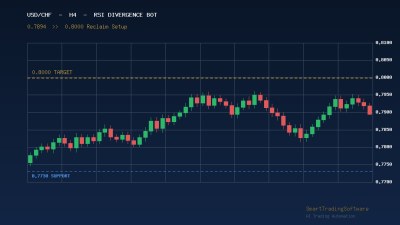
A pure range strategy works until it doesn't. The single largest risk right now is a clean break of $4,645 that invalidates the entire thesis and opens a path toward the February consolidation near $4,313. To avoid getting caught on the wrong side of that move, combining the Gold Bot with the RSI Divergence Bot provides an early-warning layer.
The RSI Divergence Bot scans for bullish and bearish momentum divergences across multiple time frames and flags them in real time. If price pushes to a fresh low at $4,640 while RSI prints a higher low, that is a strong bullish divergence and would actually increase conviction in the long entry. Conversely, if XAU/USD bounces to $4,780 but RSI fails to confirm, the bot will flag a bearish divergence and you know the range-top short is worth pressing. Using the two bots together — one for range execution, one for momentum confirmation — tends to cut the false-signal rate significantly versus either system run alone.
Supporting Indicator: Measuring Distance from the Moving Average
An often-overlooked edge in range trading is the relationship between price and its moving average. When gold trades more than 2.0% away from its 20-period EMA, mean reversion probabilities rise sharply. The MA Distance Indicator visualizes exactly this spread in real time, painting a colored histogram that makes stretched conditions obvious at a glance.
At the current $4,738, gold is sitting roughly 0.6% below its 20-day EMA at $4,767 — a neutral reading. But any stretch to 2.5% or more in either direction usually precedes a snap back toward the mean, and those are the moments when the highest-conviction range trades appear.
Key Levels to Watch in the Coming Week
Traders should keep the following levels plotted on their charts and alert systems:
Resistance: $4,760 (immediate), $4,821 (minor pivot), $4,881 (range ceiling preview), $4,926 (upper band), $4,996 (breakout confirmation above range).
Support: $4,701 (psychological and recent pivot), $4,645 (lower band), $4,576 (structural floor), $4,441 (February base).
A daily close outside either $4,645 or $4,926 changes the entire playbook. Until that happens, every session inside the range reinforces the case for the automated mean-reversion approach.
Getting Started with Automated Gold Trading
To put this setup to work on your own account:
1. License the Gold Bot and attach it to an M15 or H1 XAU/USD chart in MetaTrader 4 or 5.
2. Add the MA Distance Indicator in the sub-window for visual confirmation of stretched conditions.
3. Optionally deploy the RSI Divergence Bot on the same chart as a confirmation-only expert advisor.
4. Configure entry zones, stops and take profits as outlined above, then run a 90-day backtest on recent gold tick data before switching to live execution.
5. Start with reduced lot sizes — gold's volatility during the current conflict is well above the five-year average, and position sizing should reflect that.
If you need help tuning parameters for your specific broker spreads, account size or risk appetite, our team is available to walk through the configuration. Contact us through the contacts page and we'll put you in touch with an analyst who trades gold daily.