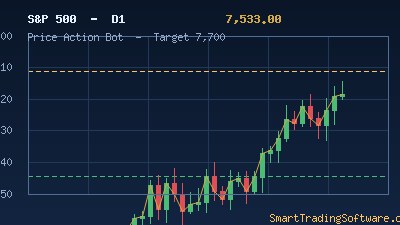
S&P 500 Pushes Toward 7,396 Resistance After Tagging Fresh All-Time High
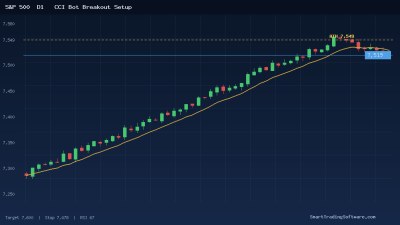
The S&P 500 is trading at 7,327 in early May 2026 after printing a fresh all-time high of 7,382 on May 7. The advance has been powered by a clean Three White Soldiers candlestick pattern that ran from 6,574 up through 7,143, and momentum studies remain firmly in bullish territory. The MACD continues to drift higher in positive space, but the daily RSI now sits at 67 — close enough to overbought that any further extension can flip into a quick mean-reversion shake-out.
The chart is sandwiched between two well-defined battle lines. Immediate resistance comes in at 7,396, with a stretch target at 7,432. On the downside, the daily pivot at 7,331 is the line in the sand that bulls need to defend, with bigger structural support at 7,294 and 7,230. Adding to the tactical picture is the topping tail printed near 7,273 in last week's session — a reminder that supply is still active even as the index grinds higher.
Why a CCI Strategy Fits the Current S&P 500 Setup
When an index is hovering directly under a major resistance band with an RSI in the upper 60s, the Commodity Channel Index (CCI) becomes one of the most useful tools in the kit. CCI does what RSI struggles to do at extremes: it measures the deviation of price from its statistical mean, which lets traders separate sustainable trends from blow-off pushes. On the S&P 500's current daily setup, CCI readings above +200 around the 7,396 retest would signal an extended condition, while a sharp roll back below the +100 line would be a textbook cue that distribution is starting.
The challenge with manually trading this kind of indicator-driven setup is that the cleanest signals usually trigger between sessions, when a discretionary trader can't react in time. That is exactly the gap our CCI Bot is designed to close — it monitors the chosen MetaTrader 5 instrument 24/5, fires entries the moment the CCI crosses pre-defined thresholds, and manages the position with strict risk parameters baked in from the start.
Suggested Entry Logic
For a long continuation play on the S&P 500 (US500 / SPX500 CFD), wait for a daily close above 7,396 with CCI(20) holding above +100 but below +250. That keeps you out of buying a vertical exhaustion candle. For the short reversal play, look for a rejection wick under 7,396 paired with CCI breaking back below the zero line.
Stop Loss and Take Profit
Long bias: stop loss tucked below the 7,294 swing support, first take-profit at 7,432, second target at the round 7,500 level. Short bias: stop loss above 7,396 wick high (around 7,415), take-profit cascade at 7,294, 7,230, and the deeper 7,138 gap fill. Risk per position is best capped between 0.5% and 1% of account equity given how late-cycle the move is.
Timeframe and Confirmation
Daily and 4-hour CCI signals have produced the cleanest trades on the index over the last quarter. Lower timeframes will trigger more often but bring substantially more noise, especially around the cash-equity open at 14:30 UTC.
Why Automation Outperforms Discretionary Trading on Indices
Indices like the S&P 500 are notorious for fast intraday rotations driven by macro headlines and Fed-related repricing. A bot that follows a disciplined CCI rule does not flinch when CNBC pivots its narrative or when a single Magnificent Seven name has an outsized session. Concentration risk in the index has never been higher — the top 10 stocks now represent roughly 35% of the S&P 500's weight, which means earnings season can swing direction within minutes. Automation removes the emotional component and enforces position sizing that a human trader will routinely override after a winning streak.
Before deploying capital on a live account, the smart workflow is to back-test the same logic on historical S&P 500 data. Our Indicators Tester lets you replay the past 5+ years of price action and validate the CCI threshold combinations that actually work for index trading rather than relying on settings imported from forex or crypto tutorials. Pair that with the MA Distance Indicator on the same chart and you get a second confirmation layer that filters out CCI signals that fire while the index is mean-reverting too aggressively.
Key Levels to Watch This Week
The cleanest decision points on the S&P 500 right now are: resistance at 7,396 and 7,432, pivot at 7,331, and support at 7,294 and 7,230. A daily close beyond 7,432 opens the door to a measured-move push toward 7,500 and the upper boundary of the rising channel. Conversely, a high-volume break of 7,230 would invalidate the short-term bullish structure and put the 7,138 prior breakout into play. Macro cycle work suggests that Q2 and Q3 of 2026 carry an elevated probability of spike volatility, so position sizing should reflect a market that can travel 1.5–2% in a single session if catalyst risk hits.
Getting Started With the CCI Bot
If this setup matches the way you already think about the index, the path to deployment is straightforward:
1. Pick up the CCI Bot from the Expert Advisors catalogue and install it on your MetaTrader 5 terminal alongside your S&P 500 CFD chart.
2. Configure the CCI period (default 20), the upper and lower trigger thresholds, and the daily timeframe filter as outlined above.
3. Run the configuration through the Indicators Tester against the last 12 months of US500 data to confirm the parameter set holds up across both trending and mean-reverting regimes.
4. Deploy on a demo account for at least two full weeks before sizing up to live capital — give the bot time to encounter both a trend day and a chop day.
The S&P 500 is sitting in one of the most well-defined technical zones of the year, and that kind of clarity does not last long. If you want help fine-tuning the CCI Bot for the specific index CFD your broker offers, or sizing the strategy against your existing portfolio, our team is one click away on the contact page.