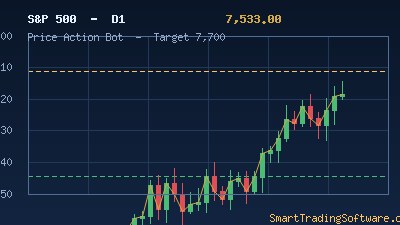
S&P 500 Holds Above 7,080 Breakout Zone as Bulls Defend New Territory
The S&P 500 is trading at 7,109 points on April 23, 2026, consolidating just above the freshly reclaimed 7,080-7,130 zone that previously capped the index at its all-time high. After a 0.41% dip in the latest session, the benchmark still sits up roughly 8.4% over the past month and close to 30% year over year, leaving bulls with a healthy cushion but no room for complacency at such a pivotal chart level. What used to be a ceiling is now being retested as support, and the way price behaves here over the next several sessions will likely dictate whether the next leg is an extension toward 7,375 or a deeper pullback into the mid-6,000s.
Technical traders are watching the 7,080-7,130 band like hawks because that zone sits right where multiple trend lines intersect: the rising channel from the late-2025 lows, the 20-day exponential moving average drifting near 7,095, and the horizontal resistance that shaped the February and March highs. A clean hold above that cluster keeps the medium-term Elliott Wave count pointed at 7,132-7,375 first, and potentially 7,900 if momentum broadens. A daily close back below 7,080 that fails to reclaim the zone on a retest would be the first warning that the breakout was a trap.
Trading the Breakout-and-Hold Setup With a Trend Following Framework
The cleanest way to trade an index that is pressing into new territory is to let the trend do the heavy lifting rather than trying to pick a top. Because the S&P is already north of its prior high, aggressive short setups are low-probability; instead, the higher-odds play is buying orderly pullbacks into the 7,080-7,130 shelf and riding with the primary trend until price action breaks structure.
Traders running this kind of playbook manually are often caught flat-footed because pullbacks into support can happen in a single Asian-session candle while they are asleep. That is exactly the kind of repetitive, rule-based execution that an automated moving-average and trend-line strategy handles without emotion.
Entry Parameters
A sensible long trigger is price pulling back into 7,090-7,110 on the H4 chart and forming a bullish reversal candle (engulfing, pin bar, or inside-bar breakout) while the 50-period EMA on H4 remains above the 200-period EMA. Requiring RSI(14) to rise from below 50 back through 55 adds a momentum filter that keeps you out of bleeding markets.
Stop Loss and Take Profit
Place the initial stop below 7,060, just under the April 18 swing low and beneath the lower edge of the breakout zone. First target is the 7,250 round number, where profit-taking typically clusters, followed by 7,375, which aligns with the measured-move projection of the prior base. A trailing stop using a 3x ATR(14) calculation on H4 helps lock in gains if price accelerates toward the 7,900 extension target without forcing a premature exit.
Position Sizing
Risk per trade should stay at 0.5-1% of account equity given the wider stops that breakouts require. Index futures and CFDs have meaningful slippage near session opens, so using limit orders at the 7,095-7,105 zone rather than chasing market orders often improves fill quality.
Why Automation Matters at This Specific Level
When price is pinned to a known decision zone, execution timing becomes more important than chart analysis. A human trader who spots the 7,090 retest at 03:00 local time will either miss it or hesitate; an automated system that recognizes the confluence of a trend line, a moving average, and a reversal candle will act on the signal in milliseconds. Our Trend Lines Bot was built specifically for this kind of moving-average plus trend-following setup on indices and Forex majors, and it respects user-defined support/resistance bands so that signals near a zone like 7,080 are weighted differently from signals in open space.
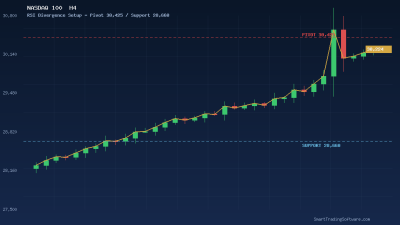
For traders who want an additional confirmation layer, the RSI Divergence Bot flags hidden and regular divergences between price and momentum on the same instrument, which is especially useful near old highs where bull traps often leave bearish regular divergence on H1 and H4 charts. Running the two side by side, with the Trend Lines Bot handling the primary trade and the RSI Divergence Bot acting as a veto on weak signals, tends to lift win rate materially on index setups.
Key Levels to Watch in the Coming Weeks
On the upside, the immediate target is 7,132, followed by the 7,250 round number and then 7,375, which matches an Elliott Wave extension from the early-2026 base. A daily close above 7,375 opens the door to 7,500 and eventually the longer-term 7,900 projection that technicians have been tracking since the index cleared 7,000.
On the downside, initial support is the top of the breakout zone at 7,080. Below there, 6,800 is the first meaningful horizontal level, and 6,600 is where the broader uptrend structure would be questioned. A weekly close below 6,780 would invalidate the current bullish count and shift focus toward a more defensive regime for the rest of Q2.
Traders should also keep an eye on the VIX: readings above 18 often coincide with failed retests at fresh highs, while sub-15 readings tend to accompany grinding trend continuation. Combining that volatility read with a mechanical trend-following system helps filter out the choppy, range-bound days that typically come after a parabolic move.
Getting Started With a Systematic S&P 500 Approach
If the 7,080 retest is compelling to you but you do not want to sit in front of the screen every night, a short checklist gets you from idea to live execution in a predictable way.
- Open an MT4 or MT5 chart of the S&P 500 CFD offered by your broker and confirm the symbol matches your historical data feed.
- Install the Trend Lines Bot and define the 7,080-7,130 zone as a user-drawn support band, with the 50/200 EMA pair as the trend filter.
- Before going live, stress-test the configuration with the Indicators Tester on at least 18 months of H1 and H4 data to confirm the setup behaves as expected in both trending and choppy regimes.
- Start with a conservative fixed-lot position size, log every trade in a journal, and only scale up after 30-40 confirmed signals show statistical consistency with your backtest.
- Review performance weekly, adjusting only the support/resistance band as price prints new structure; resist the urge to change core parameters after every losing trade.
The S&P 500 at 7,109 is giving traders a textbook breakout-and-retest invitation, but only those with the discipline to act at the zone rather than chase extensions will capture the asymmetric part of the move. If you would like help configuring any of the bots or testers for your specific broker feed, our team is happy to walk you through the setup. Get in touch here and we will point you at the right combination for your account size and trading style.