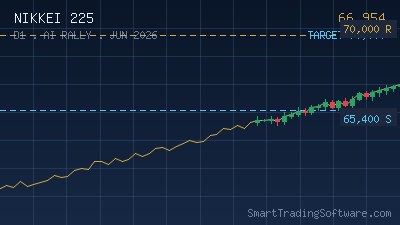
Nikkei 225 at 62,651: Record Highs Meet RSI Risk
The Nikkei 225 closed Friday at 62,651 points, just below the freshly minted all-time high of 62,833.84 printed on May 7, 2026. Japan's flagship index has run nearly 25% higher year-to-date, powered by the global AI capex cycle, robust spring wage data, and an extended carry-trade tailwind from a still-soft yen. The breakout above the 60,000 zone earlier this month has flipped that level into firm short-term support, while traders now stalk a measured-move objective at 65,000.
The forecast pipeline is constructive: consensus models point to an average of around 65,132 through the rest of May and a month-end target near 68,395. But buyers should not get complacent. Weekly RSI sits in the high-60s — momentum is still intact, yet there is no headroom left before classic overbought territory. The setup is textbook: a parabolic push into round-number resistance, with the next leg dependent on whether momentum confirms or quietly fades.
Why RSI Divergence Matters Near 65,000
When an index makes a new high but the Relative Strength Index fails to make a corresponding higher high, the result is bearish divergence — one of the cleanest distribution signals in technical analysis. Major Nikkei tops in 1990, 2007, 2018, and 2024 all printed clear weekly RSI divergence before the index rolled over. Right now, we are watching the same potential structure form in real time. A push to 65,000 with weekly RSI failing to exceed the May 7 peak would be the warning. A push to 65,000 with RSI making a fresh high would confirm continuation toward the long-term 68,000 target.
This is exactly the scenario where rule-based automation outperforms discretionary trading. Human eyes get anchored on the price chart and miss the indicator divergence; an automated system reads both inputs simultaneously and acts the moment the conditions align.
Long Continuation Setup
Entry: buy-stop above 62,900 (one tick above the May 7 ATH), valid only while the 4-hour RSI prints a fresh higher high above 70. Stop-loss: 61,750, just below the prior session swing low. First target: 64,200 (a 1:2 reward-to-risk leg). Final target: 65,000 psychological resistance, where partial profits should be booked.
Short Divergence Setup
Entry: sell-stop below 62,000 after a marginal new high (above 62,834) accompanied by lower weekly RSI. Stop-loss: 63,400 to stay above the failure swing. Target 1: 60,500 (61,000–62,000 support shelf). Target 2: 59,000 on a clean breakdown of 60,000.
Why Automation Beats the Eye in Range-Edge Trading
Index tops are emotional. After a 25% YTD run, fear of missing out drives late longs while fear of giving back profits drives early exits — both of which lead to inferior outcomes. A bot does not feel that pressure. The RSI Divergence Bot scans for the precise hidden and regular divergence patterns described above across configurable timeframes, and it executes both long-continuation and short-reversal logic without hesitation. Pair it with the Trend Lines Bot if you want a confirmation layer that anchors entries to programmatically-drawn channel boundaries.
For traders who prefer to keep an eye on the chart but want a quantitative gauge for trend exhaustion, the MA Distance Indicator plots the percentage gap between price and the 50/200 MAs in real time. A reading north of 12% on the weekly chart historically precedes mean-reversion pullbacks of 6–10%, which lines up neatly with the 59,000 zone if Nikkei stalls here.
Key Levels to Watch This Week
Resistance: 62,834 (May 7 ATH), 64,200 (1.272 fib extension), 65,000 (psychological + measured move). Support: 61,000–62,000 (post-breakout shelf), 60,000 (round-number pivot, retest level), 59,000 (50-day moving average area), 53,370 (deeper trend support). A daily close back below 60,000 would neutralize the bullish bias and re-open the 56,000–57,000 retracement zone.
Macro catalysts to watch: BoJ commentary on the policy normalization pace, Tokyo CPI mid-month, and any escalation in the AI capex narrative out of the US semiconductor leaders. The Nikkei has been one-to-one correlated with the SOX index for most of 2026, so a wobble in Nvidia-led names would feed straight back into Tokyo opens.
Getting Started with the Setup
- Backtest the divergence logic on the past 12 months of Nikkei 225 data using the Indicators Tester. Pay attention to the win rate at extension levels above 10% on the MA distance gauge.
- Install the RSI Divergence Bot on a JP225 chart in MetaTrader 5 with a 4H primary timeframe and a weekly confirmation filter.
- Set fixed-fraction position sizing to 1% of equity per trade. The 1,150-point stop on the long setup represents about 1.8% of the index value, so the system will scale your contract size accordingly.
- Add the MA Distance Indicator as a visual overlay. If it tags 12% before you get a long signal, skip the trade — that is the bot saving you from chasing the top.
- Run the configuration in demo for at least five sessions before going live. Tokyo trades a different rhythm to US indices and the bot's parameters benefit from local-time calibration.
If you would like our team to help calibrate the RSI Divergence Bot specifically for the Nikkei 225 — including custom Tokyo-session filters and yen-pair correlation overlays — drop us a note via the contacts page and we will walk you through it.