NASDAQ 100 Pushes Toward 27,000 as AI Leaders Keep the Tape Bid
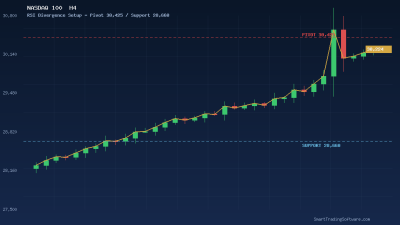
The NASDAQ 100 is printing fresh multi-month highs this week, with the index changing hands around 26,672 after last Friday's close. That is roughly 400 points shy of the 27,000 psychological barrier and just below the all-time-high shelf that traders are watching near 26,800–26,900. The tape has been remarkably orderly for an index sitting at highs: the daily RSI is reading 65 – hot but not overbought – while the weekly RSI is still holding below 70, which tells us there is room before a textbook momentum exhaustion signal fires.
The bid under the index continues to come from the usual megacap tech and AI names, but the structure itself matters more to active traders than the sector narrative. Since late March, NDX has carved out a rising channel that runs from the 25,320 pivot low up through the 26,400 shelf. The 50-day moving average sits near 25,800, the 100-day near 25,100, and the 200-day is curling up through 23,500 — a classic stacked-MA configuration that favors buying dips rather than selling strength.
The RSI Multi-Timeframe Setup for the 27K Breakout
Most intraday traders still use the 14-period RSI on a single chart, which misses the cleanest signal the index has offered in months: RSI agreement across the H1, H4 and D1 charts. When the hourly RSI pulls back below 40 while the H4 RSI stays above 50 and the daily RSI holds above 55, you get a shallow pullback inside a strong trend — the exact context in which breakout trades toward 27,000 historically work best.
The setup has three requirements, stacked top down:
1. Daily (D1) RSI > 55 — confirming the primary trend is still bullish.
2. H4 RSI > 50 with the 50 EMA sloping up — confirming the intermediate trend has not rolled over.
3. H1 RSI between 35 and 45, then turning back up — the trigger for the long entry.
This aligns the trader with institutional flow. When all three clocks agree, the probability of a continuation leg toward the next resistance is materially higher than a random dip-buy.
Entry
Place a stop-buy just above the H1 swing high that forms immediately after the H1 RSI turns back above 45. In the current structure that typically sits in the 26,720–26,760 zone. Waiting for the H1 candle to close above the pullback high filters out most of the false starts that punish pure RSI traders.
Stop Loss
Place the stop 1 ATR below the most recent H1 swing low — roughly 26,520 in today's conditions. This gives the trade room to breathe through normal European-session volatility without being shaken out by the first 30-minute algorithmic flush.
Take Profit
The first target is the 26,900 all-time-high shelf. A second partial at the round 27,000 handle captures the psychological spike. Runners can trail a stop under each new H1 higher low, aiming for the measured move toward 27,400 that the rising channel projects.
Why Multi-Timeframe RSI Rewards Automation
The problem with the RSI MTF setup is not the logic — it is the discipline. You have to watch three charts simultaneously, reject dozens of partial signals, and act inside a narrow window when all three timeframes align. That is exactly the kind of repetitive, rules-based work that a bot does better than a human screen-watcher.
Our RSI Multi Time Frame Bot was built for exactly this scenario. It monitors the D1, H4 and H1 RSI in parallel, enforces the alignment conditions, and only fires when every filter is satisfied. It also manages partial take-profits and trailing stops automatically, so you can walk away from the screen while the trade plays out.
For traders who prefer a cleaner trend-following overlay, the Trend Lines Bot plots and trades automatic trend channels on NDX and can complement the RSI MTF approach by confirming whether price is still inside the rising channel before the RSI entry triggers.
Before deploying either on a live account, we strongly recommend running the strategy through our RSI Multi Time Frame Tester. It replays the exact NDX tick history so you can see how the 55/50/40 threshold logic would have performed across the last 12 months, including the February pullback and the March rally into current levels.
Key Levels to Watch This Week
Resistance:
• 26,800–26,900 — the all-time-high shelf and the first place sellers will try to fade the move.
• 27,000 — the round-number magnet; expect a liquidity sweep if price tags it.
• 27,400 — the measured-move projection from the March 25,320 low.
Support:
• 26,400 — the shelf that has held every daily close for the last two weeks.
• 25,800 — the rising 50-day moving average; a daily close below this flips the H4 trend bias to neutral.
• 25,100 — the 100-day moving average and the invalidation level for the larger bullish structure.
A daily close back under 26,400 would invalidate the near-term breakout thesis and push the active plan into range-trading mode between 25,800 and 26,600. A clean break above 26,900 on heavy volume opens the door for the 27,400 measured move within 3–5 sessions.
Getting Started With the NASDAQ 100 RSI MTF Strategy
If you want to trade this setup without babysitting three charts for hours a day, here is the fastest path:
1. Open the RSI Multi Time Frame Bot product page and review the default NDX parameter set.
2. Download the matching RSI MTF Tester and run a 12-month backtest on NDX H1 data to confirm the threshold logic matches your risk profile.
3. Deploy the bot on a demo account first, verify it enters only when D1>55, H4>50 and H1 crosses back above 45.
4. Start live with 0.5–1% risk per trade, scaling the lot size only after 20 trades of live confirmation.
5. Layer the Trend Lines Bot on a second chart if you want an additional channel-break confirmation before the RSI trigger fires.
The NDX move into 27,000 is the kind of setup that rewards traders who are already in position before the breakout, not the ones chasing the first 15-minute spike. If you want to talk through the parameters or get help wiring the bot to your MT4 or MT5 broker, our team is one click away on the contact page — we will reply within one business day.