NASDAQ 100 Faces Overbought Conditions Near 25,800 Resistance
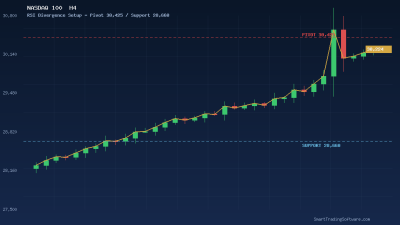
The NASDAQ 100 is approaching a critical inflection point in May 2026, trading near 25,800 after a sustained rally driven by continued AI-related capital flows and easing rate expectations. The index has been carving out a symmetrical triangle pattern with resistance capped near 26,054 and support holding around 24,112, but momentum is showing signs of exhaustion. The 14-day RSI has pushed to 77.7, deep into overbought territory, while price action has stalled just below the psychological 26,000 round number.
This combination of overbought momentum and stalling price near major resistance is a textbook setup for a corrective pullback. Traders watching the daily chart will notice that the index has now spent multiple sessions consolidating in a tight range, with each rejection from the 25,800-26,000 zone leaving behind upper wicks. Should the RSI begin to roll over while price prints a lower high, a bearish divergence will register, often a precursor to a sharper downside move.
The RSI Divergence Strategy for the Current NASDAQ Setup
RSI divergence is one of the most reliable signals for catching trend exhaustion at major levels. A bearish divergence forms when price prints a higher high but the RSI prints a lower high, a structural mismatch that betrays weakening momentum even as price appears strong on the surface. With the NASDAQ 100 at 25,800 and RSI already at 77.7, the conditions are ripe for this signal to fire if the index attempts another push toward 26,054.
Entry Trigger
A short entry should be considered after a confirmed bearish divergence on the H4 or daily timeframe, ideally on a candle close back below 25,650. Traders should wait for the RSI to break below 70 as confirmation that overbought momentum has dissipated rather than entering on the divergence alone.
Stop Loss Placement
A stop loss above 26,150 gives the trade enough room to survive a final blow-off attempt without invalidating the structural thesis. This places the stop just above the recent swing high and the upper boundary of the consolidation range.
Profit Targets
The first take-profit target sits at 25,000, the midpoint of the broader range and a clear psychological level. The second target aligns with 24,112, the lower boundary of the symmetrical triangle and the most recent meaningful swing low. A break below this level opens the door to 24,000 round-number support, with deeper extensions possible toward the 20,690 long-term pivot.
Why Automation Strengthens Divergence Trading
Divergence patterns are deceptively simple in theory and surprisingly difficult to execute in practice. The challenge is that bearish divergences can persist for several candles before price actually rolls over, and the temptation to enter early or exit prematurely tends to ruin otherwise valid setups. Automated systems remove this emotional friction.
Our RSI Divergence Bot continuously scans the chart for valid divergences using configurable RSI period and lookback parameters, then waits for the precise confirmation candle before triggering an entry. Because the bot ignores noise from short-lived RSI fluctuations, it filters out the false signals that catch discretionary traders. Combined with the Support & Resistance Indicator, traders can ensure entries align with major horizontal levels like the 25,800 ceiling rather than firing on minor pivots.
Before deploying any new configuration on a live NASDAQ chart, it is sensible to run the parameters through historical data first. The Indicators Tester lets you backtest divergence settings across multiple years of NASDAQ 100 history, confirming that your RSI period and entry thresholds produce stable results across both trending and ranging market regimes.
Key Levels to Watch in the Days Ahead
The technical map for the NASDAQ 100 is unusually clean right now, which is helpful for both manual and automated traders. On the upside, 25,800 is the immediate ceiling, with 26,054 marking the symmetrical triangle apex. A daily close above 26,054 invalidates the bearish divergence thesis and opens a measured-move target near 29,000, the level forex.com analysts have flagged as the next major psychological barrier.
On the downside, the 25,000 level acts as the first significant support, followed by the 24,112 triangle low. A clean break below 24,000 would shift the structural bias from consolidation to correction, with 20,690 emerging as the longer-term pivot. The 14-day RSI is the indicator to watch most closely; a drop back below 70 while price holds 25,800 would be the first concrete warning that distribution is underway.
Getting Started With the NASDAQ Pullback Setup
If you want to position for the potential NASDAQ 100 pullback without watching the screen all day, the workflow is straightforward:
- Download and install the RSI Divergence Bot on your MetaTrader 4 or MetaTrader 5 platform.
- Configure the bot for the H4 or daily timeframe, with the RSI period set to 14 and the lookback window tuned to capture multi-candle divergences.
- Validate the configuration using the Indicators Tester against at least two years of NASDAQ 100 history.
- Add the Support & Resistance Indicator to your chart so the bot only triggers entries near confirmed structural levels like 25,800 and 26,054.
- Set conservative position sizing — overbought reversals can stall before they fully play out, so risk per trade should reflect the volatility of an index instrument.
If you would like a tailored setup for your account size or risk tolerance, the team is happy to walk through the configuration with you. Reach out via our contact page and we'll help you fine-tune the parameters for the current NASDAQ 100 environment.