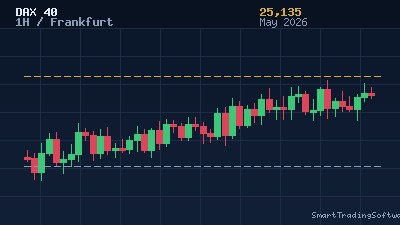
DAX 40 Stalls at 24,129 After Five Straight Down Days — Compression Sets the Stage
Frankfurt's blue-chip benchmark closed Friday at 24,129, a marginal 0.11% slip that printed the fifth consecutive session of red candles. The DAX has now spent the better part of seven months trading inside a stubborn 22,900 to 24,400 channel, and last week's rejection from the 24,309 double-top resistance pushed bulls back into the same compression zone they've been wrestling with since the autumn. Tariff headlines from Washington, a softer-than-expected German PMI print, and ECB officials hinting that the easing cycle still has at least one more cut to deliver have all collided into a market that desperately needs a directional catalyst.
What makes this setup interesting for systematic traders is the symmetry: the index is sandwiched between the classic R1 pivot at 24,431 and the classic pivot point at 23,147, with S1 way down at 21,397 as the next meaningful demand shelf. Meanwhile, sell-side desks remain split — IG and CMC are still penciling in a 27,000 year-end target on ECB easing, while Long Forecast modeling suggests April could close near 22,428, a 3.7% slide. The technical structure says the next 300 points either way will tell the rest of the story.
The Trend Lines Bot Approach to a 24,431 Breakout Test
When price coils inside a multi-month range, discretionary execution tends to fall apart — traders second-guess fakeouts, move stops too tight, or fade the eventual breakout because it "looks extended." This is precisely the environment where automated trend-following logic earns its keep. The Trend Lines Bot uses a moving-average filter combined with a structural higher-high / higher-low detector to wait until a confirmed slope shift is in place before pulling the trigger. On the DAX H4 chart, that filter has been flat for three weeks — exactly what you would expect inside a triangle.
Long Setup — Entry, Stop, Target
The trade we are watching: a confirmed H4 close above 24,431 with the bot's MA slope flipping positive. Entry on the next bar open, stop-loss tucked below 23,950 (the swing low from earlier this week and just under the 50-period EMA), and a first take-profit at 24,950 — a 1:1 reward versus the 480-point stop. The Trend Lines Bot's trailing logic then activates beyond the first target, lifting the stop to break-even and following price toward the longer-term 25,400 measured-move objective. Position size should scale to no more than 1% of equity per trade, which on a 50,000 EUR account translates to roughly 0.5 lots of the DAX 40 CFD given current volatility.
Short Setup — Entry, Stop, Target
The mirror trade for the bears: a clean H4 close below 23,950. The bot then opens shorts at the next bar with a stop just above 24,250 and a first target at the 23,150 pivot. A break of that pivot opens the door to 22,400 — the level Long Forecast's April projection leans on — and the trailing stop continues to ride the slope until the MA flattens again.
Why You Want a Bot Watching This Range, Not You
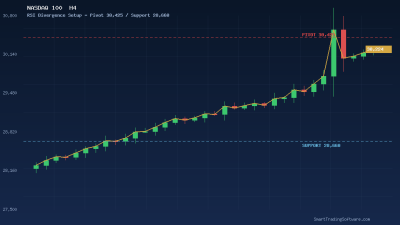
The DAX has been the textbook definition of a chop machine for the last seven months. Manually monitoring 24-hour-a-day futures pricing across three sessions is exhausting and the human cost of execution slippage adds up fast — even more so when the index decides to break at 03:30 CET on a Tuesday. The Trend Lines Bot sits on the chart, ignores the noise, and only fires when the structural and slope filters align. Pair it with the RSI Divergence Bot as a confirmation layer — the divergence engine flags exhaustion at range edges, which dovetails neatly with trend-following logic at the breakout point. And before any of this goes live, run the whole stack through the Indicators Tester on at least three years of DAX H4 history so you know exactly what the worst drawdown looks like before you risk a single euro.
Key Levels Every DAX Trader Should Have Marked This Week
From the upside in: 24,431 is the classic R1 pivot and the immediate breakout trigger. Above that, 24,950 is the measured move from the recent base, then the 25,400 swing high from earlier in the cycle, and the IG/CMC consensus target of 27,000 sits as the longer-horizon magnet if the ECB delivers another cut. From the downside in: 23,950 is the immediate breakdown pivot, 23,147 is the classic monthly pivot, 22,900 is the base of the seven-month range, and 21,397 is the S1 floor that would only come into play on a confirmed bearish regime change. Anything between 23,950 and 24,431 is no-trade territory — that is the meat of the chop and exactly where the bot stays flat.
Getting Started With Automated DAX Execution
If you want to run this exact playbook on your own MetaTrader terminal, here is the order of operations:
- Download the Trend Lines Bot and attach it to a DAX 40 H4 chart in MetaTrader 4 or 5.
- Add the RSI Divergence Bot on a separate chart of the same instrument as a confirmation overlay.
- Run a 3-year backtest with the Indicators Tester using realistic spread and commission inputs.
- Forward-test on a demo account for 4 weeks before increasing position size.
- Configure your broker's risk caps so no single trade exceeds 1% of equity, and keep the bot's daily-loss circuit breaker at 3%.
If you'd like help calibrating the parameters to your own broker's spread profile or to a different DAX timeframe, our team is happy to walk through it — get in touch via the contact page and we'll pair you with the setup that matches how you actually trade.