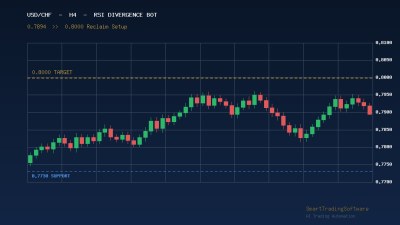
USD/CHF Tests 0.80 Resistance as Swiss Franc Strengthens
The US Dollar/Swiss Franc pair is trading at 0.7836 as of mid-April 2026, having just rejected the critical 0.80 psychological resistance zone where the 200-day EMA is converging. Over the past month, the Swiss Franc has strengthened 1.21% against the dollar, and the pair is down 4.15% over the last twelve months. This decline marks a significant correction inside the longer-term downtrend that began at 0.9200, with price now probing the 0.7833 pivot that has acted as immediate support on multiple daily closes.
What makes the current setup particularly attractive for systematic traders is the confluence of technical signals clustering between 0.7957 and 0.8072. This zone houses the 200-day EMA, a short-term resistance cap, and the 38.2% Fibonacci retracement of the 0.9200 to 0.7603 decline. Price rejected this area earlier in April, printing what appears to be a classic bearish divergence on the daily RSI — a setup our RSI Divergence Bot has been built specifically to detect and execute.
The RSI Divergence Short Setup Explained
Bearish RSI divergence occurs when price makes a higher high while the Relative Strength Index prints a lower high, signaling waning bullish momentum. On the USD/CHF daily chart, the April rally to 0.7957 produced an RSI reading notably weaker than the prior swing high near 0.80, suggesting institutional sellers are offering supply into strength. Rather than waiting for news catalysts, an automated divergence scanner timestamps these moments mechanically and can pre-position short orders below confirmed lower highs.
Entry Parameters
The cleanest entry triggers on a daily close back below 0.7850 after a wick into the 0.7900-0.7957 zone. This confirms rejection of the 0.80 ceiling and validates the divergence signal. Scale-in traders may prefer splitting the position — half short on the initial rejection, the second half on a break below 0.7833 which would confirm a short-term lower low.
Stop Loss Placement
Stops belong above the April swing high and 200-day EMA cluster. A stop at 0.8010 sits just above the 0.80 round number, giving roughly 175 pips of room from a 0.7850 entry. Tighter swing traders can tuck stops above 0.7965, accepting the higher risk of a shakeout before the intended move.
Take Profit Targets
First target is the prior swing low at 0.7690, offering a reward-to-risk ratio of roughly 1:1. The second target sits at 0.7603, the 2026 low, producing approximately 2.5:1. A final runner can target 0.7535 on a break of the yearly low, historically a zone of weekly support from 2011. Partial profit-taking at each level helps lock gains while letting a portion ride toward extension targets.
Why Automation Matters for Divergence Trading
Divergence is one of the most over-discussed but under-executed setups in retail forex. The reason is simple — it requires patient multi-bar confirmation and discretionary traders frequently either jump in too early on the first RSI slip or dismiss valid signals because the price action looks scary in real time. A dedicated algorithm removes the hesitation entirely, logging every divergence instance, filtering by timeframe and strength, and executing only when pre-defined criteria align.
The STS RSI Divergence Bot at €421 handles this workflow on MetaTrader 4 and 5. It scans for both regular and hidden divergences across any currency pair, including USD/CHF, and can be configured with position sizing, trailing stops, and session filters. Traders who prefer to validate a logic before deploying real capital should start with the Indicators Tester at €155 — it lets you backtest divergence behavior across multiple years of historical USD/CHF data to understand hit rates and drawdown profiles before going live.
Key Levels to Watch This Week
Traders should monitor the following zones for trade triggers and invalidation:
Resistance: 0.7957 (immediate ceiling), 0.8000 (round number + 200-day EMA), 0.8072 (short-term pivot), 0.8213 (38.2% Fib).
Support: 0.7833 (current pivot), 0.7690 (March swing low), 0.7603 (2026 low), 0.7535 (measured move target).
A daily close above 0.8072 would invalidate the immediate short thesis and suggest a broader corrective leg higher — potentially reaching 0.8213 before fresh supply appears. Conversely, a weekly close below 0.7690 opens a measured move toward 0.7400, which would be a multi-year bearish continuation consistent with continued dollar weakness and Swiss National Bank reluctance to intervene at current levels.
Getting Started with the USD/CHF RSI Divergence Strategy
Here is a structured approach to deploying the setup on your own account:
- Download and install the RSI Divergence Bot on a MetaTrader 4 or 5 demo account first.
- Set the symbol to USDCHF, timeframe to daily for the primary signal and H4 for refinement.
- Configure the RSI period to 14, divergence lookback to 15 bars, and enable the bearish-only filter if you want to trade the current regime alone.
- Combine signals with the MA Distance Indicator at €25 — it helps confirm that price is stretched from its 50 or 200-day MA, which strengthens mean-reversion divergence signals.
- Backtest across at least the 2020-2026 period using the Indicators Tester. You want a minimum 55% win rate with reward-to-risk above 1.8:1 on your specific parameter set.
- Deploy live with 0.5% risk per trade until you have accumulated at least 30 live executions to build statistical confidence.
If you need help configuring the bot for USD/CHF or would like guidance on combining divergence with additional confluence filters, reach out through our contact page. Our analyst team regularly reviews client setups and can suggest parameter refinements for specific account sizes and risk profiles.