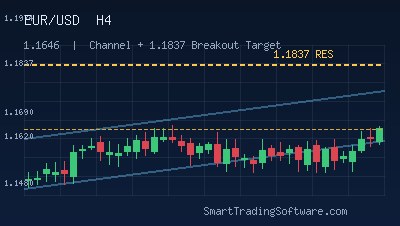
EUR/USD Breaks Above 1.1700 as ECB Rate Hike Bets Accelerate
The euro has pushed above the psychological 1.1700 handle against the U.S. dollar in mid-April 2026, printing its highest levels since late February and posting a weekly gain of roughly 1.5%. The rally is being driven less by technicals alone and more by a dramatic repricing of European Central Bank policy: traders are now discounting close to three additional ECB rate hikes by year-end, fueled by Brent crude pushing near $102 a barrel and persistent energy-led inflation. With EUR/USD trading around 1.1720, the pair is sitting on a critical shelf that will decide whether bulls can extend the move toward 1.1840, or whether profit-taking triggers a pullback into the 1.1640 demand zone.
For systematic traders, the more interesting question is not where EUR/USD prints next, but how to measure the strength of the momentum behind the move. That is where a moving average distance framework becomes invaluable, and where automation can translate a clean technical signal into consistent execution.
The MA Distance Strategy: Reading Momentum Stretch Objectively
The core idea of the Moving Average Distance approach is simple but powerful. Rather than just asking whether price is above or below a moving average, you measure how far price has travelled from it, in pips or as a percentage. That distance, tracked historically, tells you when a trend is healthy and extending, when it is overstretched and vulnerable to mean reversion, and when a pullback to the MA is a gift entry rather than a trend-reversal warning.
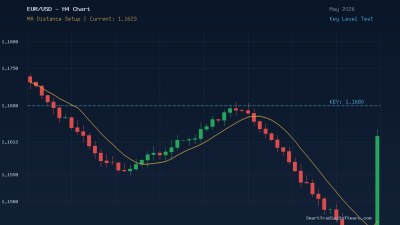
On the current EUR/USD daily chart, price at 1.1720 is trading modestly above the 20-day SMA near 1.1733 and back in control of the 30-day SMA around 1.1694. The pair has historically seen extreme distance readings in the 120–160 pip zone above the 50-day average before mean-reverting. That gives us a measurable framework: as long as EUR/USD holds above the short-term average and distance remains below the historical extreme, the bullish setup is intact.
Entry Criteria for Longs
Wait for a pullback into the 1.1690–1.1705 band, overlapping the 30-day moving average. The trigger is a bullish daily close back above 1.1720 with MA distance expanding rather than contracting. Avoid chasing green candles when the 20-day distance is already stretched beyond the prior week's high.
Stop Loss and Take Profit
Place the stop below 1.1640, which coincides with the prior swing low and the first published support level. That gives roughly 60–80 pips of risk from a 1.1705 entry. First take-profit at 1.1780 — a logical intermediate resistance cluster. Second target at 1.1840, where we would expect MA distance to flash overextended and demand a decision. A trailing stop anchored to a 20-day moving average offset can lock in gains between these two targets.
Invalidation
A daily close below 1.1640 flips the setup. At that point distance inverts — price drops below both short-term averages — and the longs should be stood down. Below 1.1590 the structural bias shifts and bears take over down to 1.1530.
Why Automation Matters for This Setup
MA distance strategies look clean on a chart but are surprisingly hard to execute manually. You need to track a rolling statistic, compare it to historical extremes across multiple lookback windows, and act at the exact moment price closes back through the moving average. Humans are slow, emotional, and tend to shorten stops during news-driven volatility — exactly the regime EUR/USD is in right now with every ECB speaker moving the pair 40–60 pips.
An MT4/MT5 expert advisor built around moving average distance removes that emotional layer. The MA Distance Indicator measures real-time distance between price and any moving average, alerting when readings cross historical percentile thresholds. Paired with a historical tester, you can confirm whether the current setup would have been profitable across prior ECB tightening cycles before risking live capital.
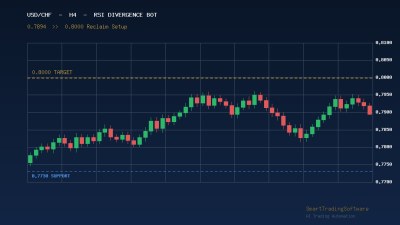
Traders who prefer to layer a second confirmation often combine MA distance with divergence logic. The RSI Divergence Bot is designed to catch momentum exhaustion signals that frequently line up with MA distance extremes, filtering out many of the chop trades that plague pure trend-following systems around big data releases.
Key Levels to Watch on EUR/USD This Week
The map for the coming sessions is fairly well defined. On the upside, 1.1720 is the pivot; a hold above opens 1.1780, then 1.1840 as the major technical ceiling. Above 1.1840, market structure would flip into a new leg toward the 1.22 longer-term projection floated by several banks for year-end 2026. On the downside, 1.1640 is the line in the sand, followed by 1.1590 and 1.1530 as deeper support. The daily momentum indicators — 12 buy signals versus zero sell signals on the consolidated technical scorecard — lean firmly bullish, but overextended distance readings into 1.1840 would be the first red flag for longs.
Fundamentals continue to back the technical picture. With ECB hike probability for the April 30 meeting above 80% and the Fed still biased toward cuts, the policy divergence story supports euro strength. The risk to the thesis is a sudden cooling in oil prices or a diplomatic breakthrough that pulls inflation expectations lower and removes the hawkish ECB narrative overnight.
Getting Started with a Systematic MA Distance Approach
If you want to trade this EUR/USD setup with discipline rather than hope, here is a practical order of operations:
- Load the MA Distance Indicator onto a daily EUR/USD chart and benchmark the current reading against the trailing 100-day distribution.
- Run a historical backtest with the Indicators Tester across the last three ECB tightening windows to validate expectancy, win rate and maximum drawdown for the distance thresholds you plan to trade.
- Deploy the RSI Divergence Bot as a secondary confirmation layer so that entries require both momentum exhaustion and a favourable MA distance reading.
- Start with a reduced lot size and a hard daily loss cap until you have at least 20 live signals logged on EUR/USD.
- Re-evaluate after each ECB or Fed event — MA distance regimes shift sharply around central bank pivots, and parameter tuning is expected.
If you are unsure which configuration suits your account size or broker, the STS team can walk you through parameter selection and risk sizing on request — reach out via the contact page and we will help you set it up.