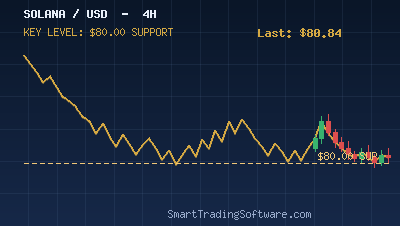
Solana Coils Below $88.93 Resistance as $90 Breakout Looms
Solana (SOL/USD) is changing hands near $88.56 in early May 2026, sitting in a tight consolidation directly underneath the $88.93 resistance shelf that has capped every rally attempt for the past two weeks. The pair is up roughly 4% in the last 24 hours, +5.2% on the week and +8.1% over the trailing 30 days, a slow-grind recovery that has rebuilt buyer confidence after the April pullback toward the $84 support pocket.
The technical picture is constructive but not yet committed. The 14-day RSI prints near 53, which keeps the coin firmly in neutral territory, and the daily MACD has flattened after a short-lived bullish cross. Ten of thirteen tracked moving averages still flash a buy signal, suggesting that dips are being absorbed rather than trended. Twenty-three momentum indicators tilt 52% in favor of bulls (12 buy / 5 sell / 6 neutral), which is the kind of cautiously positive backdrop that often precedes a breakout — provided the right catalyst lands.
The $88.93 Breakout Setup: What the Tape Is Telling Us
The trade we are tracking is a continuation breakout of the $88.93 ceiling. A clean daily close above this level, ideally on volume that exceeds the 20-day average, opens the door toward $90.84 first and the $92-$96 cluster that several momentum models are projecting for late May. Failure to clear $88.93 — particularly with shrinking volume — keeps SOL pinned inside the $84-$89 range, where mean-reversion plays are the higher-probability move.
This is exactly the kind of setup where an automated strategy outperforms manual trading. Discretionary traders tend to anticipate the breakout, get filled inside the noise zone, and then close on the first dip back below the breakout line. A rules-based bot waits for confirmation, enters on close, and lets the trailing stop manage the trade.
Entry, Stop, and Target Parameters
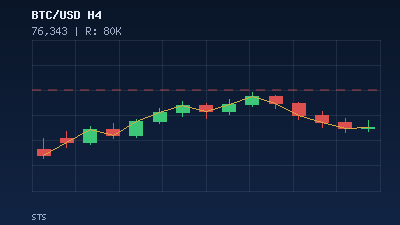
For traders building this around our Crypto Bot, the parameter block we are running on the H4 chart looks like this:
Entry trigger: Daily close > $88.93 with volume > 1.1x the 20-day average. Aggressive variant: H4 close > $89.10 with positive MACD histogram.
Initial stop-loss: $86.40, just below the rising 20-day moving average and the $87.16 minor support.
Take-profit 1: $90.84 (close 50% of position).
Take-profit 2: $93.00 (close 30%).
Take-profit 3: $95.50 (trail the remaining 20% with an ATR-based stop).
Risk-to-reward on the first target alone sits near 1:1, but the runner trade pushes the blended R:R above 1:2.5, which is the threshold most systematic crypto strategies need to stay profitable across cycles.
Why Automating This Trade Beats Watching It
SOL is a 24/7 market and the cleanest breakouts in this consolidation have printed during U.S. overnight hours, when most retail traders are not at the desk. That is the structural reason a bot wins here: it does not sleep, it does not flinch on the wick, and it does not move the stop after a bad night.
The Crypto Bot handles the breakout-and-pullback logic natively, with configurable volume confirmation and a built-in re-entry rule for the case where price flushes the stop and reclaims the breakout level within a fixed window. Pair it with the RSI Divergence Bot on a lower timeframe and you get a second opinion: if the H1 RSI prints a bearish divergence as price tags $90.84, the divergence bot can scale out automatically rather than waiting for $93.
For traders who prefer to hold the strategy on a known support map rather than indicators alone, the Support & Resistance Bot can be configured with the $84 / $87.16 / $88.93 / $90.84 levels we have mapped above and will pyramid into strength as each shelf flips from resistance to support.
Key Levels to Watch This Week
The map for the next five sessions is straightforward:
Resistance: $88.93 (immediate ceiling), $90.84 (next supply), $93.00 (May target zone), $95.50 (extension).
Support: $87.16 (intraday floor), $85.26 (range low), $84.00 (must-hold for the bullish thesis), $80.00 (last-line defence; a break here invalidates the setup).
A daily close below $84 flips the bias outright. In that scenario the systematic play is to flatten the long bot and let the strategy go flat until SOL either reclaims $87 or carves out a new base near $80 — both of which the bot can detect from the same level set without any code changes.
Getting Started: From Levels to a Live Strategy
If you want to run this Solana setup yourself, here is the minimum viable path:
1. Backtest the breakout logic on the last 90 days of SOL/USD H4 data using our Indicators Tester so you can see how the $88.93 / $90.84 / $93.00 ladder would have performed against the April range break.
2. Install the Crypto Bot on your MetaTrader 5 terminal and load the parameter block above. Run it on a demo account for at least 48 hours before going live — Solana volume profiles change quickly around U.S. macro releases.
3. Add the RSI Divergence Bot as a second opinion on H1, with notifications only (no auto-execution) until you are comfortable with the signal cadence.
4. Define your maximum daily drawdown in the bot panel — for a $10k account, capping daily loss at 1.5% (i.e. $150) keeps the strategy alive across bad weeks.
5. Review the trade log every weekend and adjust the level set if SOL prints new swing highs or lows.
Have a question about wiring the Solana setup into your existing MT5 environment, or want help tuning the volume filter for your broker's data feed? Reach out via our contact page and the desk will walk you through the configuration that fits your account size and risk profile.