Ethereum's Make-or-Break Moment at the $2,361 MA Convergence
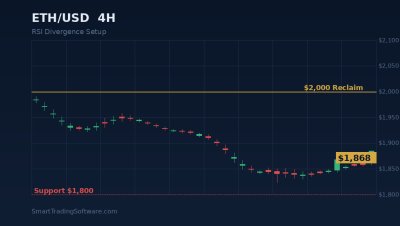
Ethereum is trading near $2,275 in early May 2026, hovering just below one of the most consequential technical clusters of the year. The 50-day moving average sits at $2,361 while the 200-day moving average rests at $2,367 — a tight convergence inside a $6 band. Convergences this narrow on the daily chart of a major asset are rare, and they almost always resolve into a strong directional move once price decides which side of the cluster wins.
The shorter-term picture is bearish: ETH has printed a sequence of lower highs and lower lows, currently trades below its 20, 50, 100 and 200-day EMAs, and the 14-day RSI reads 48.58 — neutral, but tilting toward the soft side of indecision. That is exactly the kind of profile where a clean break of a technical wall becomes the trigger event for the next multi-week swing.
Immediate support is layered at $2,260, $2,250 and $2,240, with the May low at $2,240.96 acting as the line in the sand for bulls. To the upside, intraday resistance comes in at $2,290 and $2,311 before price meets the moving average cluster around $2,361–$2,367. A daily close above that band flips both moving averages from resistance to support and opens the road toward $2,449 and the $2,479–$2,550 May target zone.
How to Trade the MA Convergence with an RSI Divergence Strategy
The setup that fits this market profile best is a momentum-confirmed breakout. Price is compressed, RSI is mid-range, and the supply zone at $2,361/$2,367 is well-defined. A pure breakout rule will get chopped up by the dozens of failed pokes that crowded MA clusters tend to produce. A breakout filtered by an RSI divergence reading is a different animal — it asks for momentum to confirm price before the trade even fires.
The mechanic is straightforward. As ETH grinds against the $2,361 ceiling, the bot scans for a bullish RSI divergence on lower timeframes — price making a higher low while RSI prints a lower low, or vice versa for a short. When divergence is logged AND price closes above the cluster, the entry triggers. Without the divergence component, you will trade every tag of $2,361 and bleed in the chop. With it, the system only fires when momentum is leaning in the same direction price wants to go.
Entry, Stop Loss and Take-Profit Parameters
For the long side, the entry is a daily close above $2,375 — three to four dollars above the 200-day MA to filter wick fakes. Stop loss sits at $2,330, just below the 50-day MA, giving the trade a $45 risk. The first target is $2,449 (R:R of roughly 1.6) with a runner to $2,479 and a final partial at $2,550 for a 6:1 ratio against the original stop.
For the short scenario, a rejection wick at $2,361 followed by a daily close below $2,260 triggers the entry, with a stop above $2,295 and a first target at $2,240 — the May swing low. A break of $2,240 unlocks $2,200 and the $2,120 demand zone from the late-April basing pattern.
Why Automation Beats Discretion in a Compressed Market
Compressed markets like this one punish hesitation. The cluster between $2,361 and $2,367 will be tested multiple times before it breaks, and a manual trader watching every poke will either fire too early on the first false break or miss the move entirely after fatigue sets in. An algorithm doesn't get tired and doesn't second-guess. It waits for the exact combination of signals — divergence plus a confirmed close — and pulls the trigger without flinching.
The RSI Divergence Bot automates exactly this kind of confirmation logic on MetaTrader 4 and 5. It scans for hidden and regular divergences across selected timeframes and only opens positions when the momentum picture aligns with the price structure you've defined. For traders who want a broader engine that handles multiple crypto pairs, the Crypto Bot bundles trend, momentum and volatility filters tuned for Bitcoin, Ethereum, Solana and the major altcoins.
Before deploying real capital on the $2,361 setup, the smart move is to backtest the rule on the last six months of ETH 4-hour and daily data. The Indicators Tester lets you replay historical price action with your divergence settings active so you can see exactly how often the rule fires, what the win rate is, and where the false positives come from before risking a single euro.
Key Levels to Watch This Week
The cluster at $2,361–$2,367 is the only number that really matters this week. Everything above and below is a function of how price interacts with that band. Watch for these specific reactions: a third tag of $2,361 with shrinking volume increases the probability of an upside resolution; a tag accompanied by expanding volume on red candles raises the odds of a rejection back toward $2,240. Volume divergence at the cluster is a stronger tell than any single candlestick pattern.
On the upside, a clean close above $2,367 unlocks $2,399 first, then the $2,449 supply zone, with $2,479 and $2,550 as the swing targets. On the downside, losing $2,260 puts $2,240 and the late-April lows in play, and a daily close below $2,240 changes the structure from "consolidation under MA" to "trend continuation," which would invalidate the long thesis until ETH reclaims the cluster from below.
Getting Started with the Ethereum MA Convergence Setup
Here is the operational checklist to deploy this trade on your MT5 account this week:
1. Install the RSI Divergence Bot on a chart of ETH/USD or your broker's equivalent CFD ticker. Set the divergence lookback to 50 bars and the RSI period to 14.
2. Configure the entry filter so the bot only opens longs above $2,375 and shorts below $2,260, with the stops described above hard-coded.
3. Run a 6-month backtest in the Indicators Tester using ETH H4 and D1 data to validate that the rule has been profitable across the recent regime.
4. Start with reduced position sizing — half a standard lot or less — until you have a full breakout cycle of live data. Scale up only after the first take-profit hits and the rule shows it works on your specific broker spreads.
5. Review the trade weekly. If ETH is still inside the cluster after seven trading days, tighten the entry filter to require expanding ATR before the bot fires.
Have questions about configuring the RSI divergence parameters for your specific broker or timeframe? Get in touch with our team — we'll walk you through the setup and help you adapt the rule to your account size and risk tolerance.