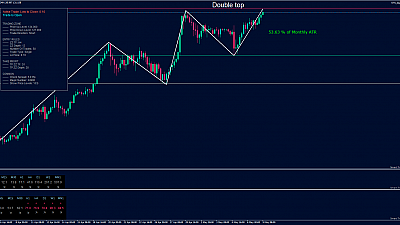
The USD/JPY currency pair has been in a strong uptrend since the beginning of the Year and our STS_ATR_Distance_Indicator shows that we have currently passed 53% of the Monthly ATR (Average Monthly movement for the last 6 months). The price is in the zone of Resistance. Our ...
USD/CHF short positions closed with STS Zig Zag Bot
As we wrote in our Analysis from 03.05.2022, the currency pair USD/CHF was at strong levels of Resistance and we expected it to make a Downward movement. We loaded our STS_Zig_Zag_Bot to open short positions on each H4 Candle with an ascending 12-period Zig Zag and to ...
EUR/USD long positions with STS Zig Zag Bot
The EUR/USD currency pair has been in a strong downward trend since the beginning of the year. The current price has not been at these levels since 2015-2017. The Fed is expected to decide on interest rates this week and data on US Nonfarm Payroll is expected on Friday. This data would be a catalyst for a highly targeted ...
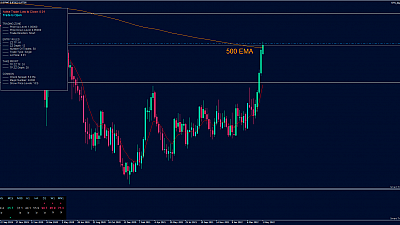
USD/CHF short positions with STS Zig Zag Bot
The currency pair USD / CHF on Weekly chart is at a 500EMA Resistance and our STS_RSI_MTF_Indicator shows overbought condition on the large timeframes - Daily, Weekly, Monthly, with an extremely high values above 70. The STS_ATR_Distance_Indicator ...
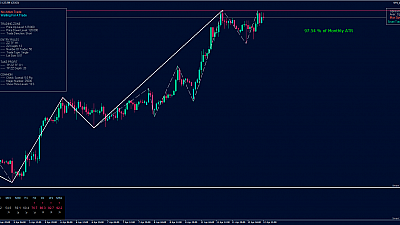
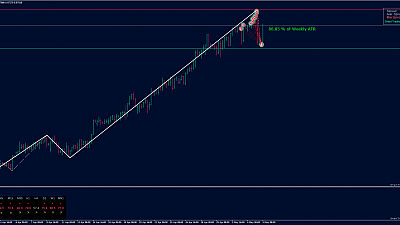
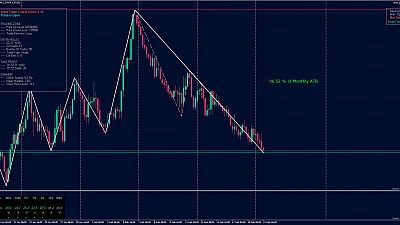
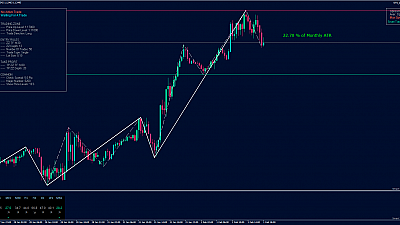
USD/JPY possibility for short positions at Monthly Resistance
The currency pair USD/JPY is at strong Resistance from the Monthly chart, and the price hasn't been at these levels since 2015. STS_ATR_Distance_Indicator shows that since the beginning of the Month the price has passed 97% of its Monthly ATR (Average Monthly Movement for the last 6 months). ...
GBP/USD long positions closed with STS Zig Zag Bot
As we wrote in our Analysis from March 11, 2022, the currency pair GBP/USD had a strong Bullish Divergence. We loaded our STS_Zig_Zag_Bot to open long positions on each H4 candle in which we had a 12-period descending Zig Zag and to close all positions on a 20-period ascending Zig Zag. ...
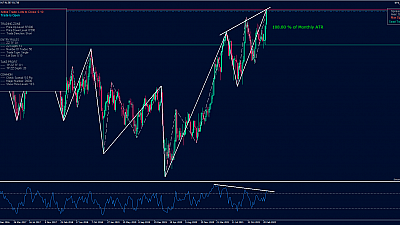
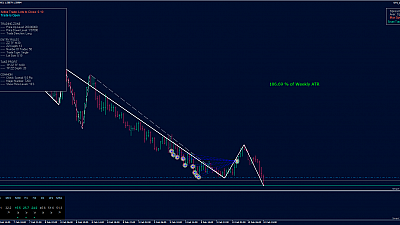
CAD/JPY short positions with STS Zig Zag Bot
The CAD/JPY currency pair has formed a strong Bearish Divergence on the Weekly Chart. STS_ATR_Distance_Indicator shows that since the beginning of the Month the price has passed 108% of its Monthly ATR (Average Monthly Movement for the last 6 months). These arguments give us a high probability for ...
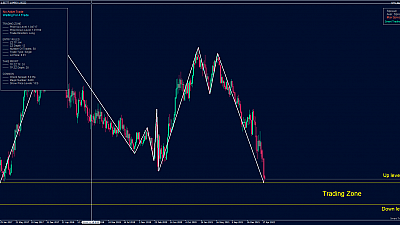
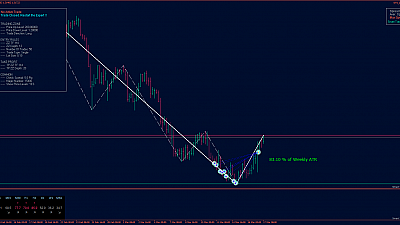
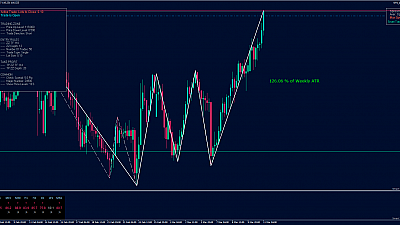
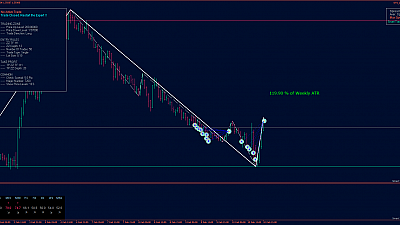
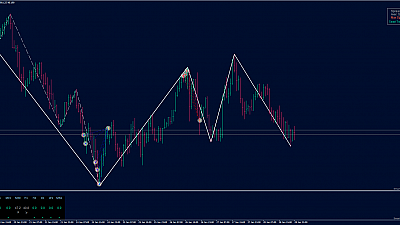
GBP/USD long positions with STS Zig Zag Bot
The currency pair GBP/USD on H4 Timeframe forms a strong Bullish Divergence. STS_ATR_Distance_Indicator shows that since the beginning of the Week the price has passed 78% of its Weekly ATR (Average Weekly Movement for the last 6 Weeks). STS_RSI_MTF_Indicator shows Oversold ...
USD/JPY short positions with STS Zig Zag Bot
The USD/JPY currency pair on the Weekly Chart has formed a strong Bearish Divergence. The STS_MA_Distance_Indicator shows that the distance to 10 EMA on a Weekly chart is 137 pips and the distance to 10 EMA on a Monthly Chart is 317 pips. The STS_RSI_MTF_Indicator shows Overbought condition ...
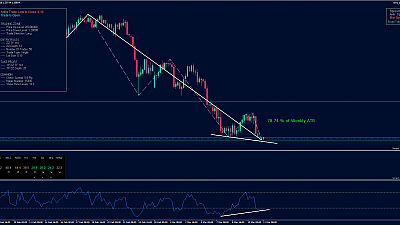
EUR/AUD long positions with STS Zig Zag Bot
The EUR/AUD currency pair is at strong Support by the 1.57 round number. STS_ATR_Distance_Indicator shows that since the beginning of the month the price has passed 96% of its Monthly ATR (Average Monthly Movement for the last 6 months). STS_RSI_MTF_Indicator shows oversold condition ...
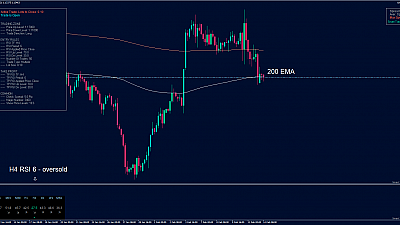
EUR/USD long positions closed with STS RSI Bot
As we wrote in our Analysis from Feb 14, 2022, the currency pair EUR/USD was at support by 200 EMA and the RSI-6 period was oversold. We loaded our STS_RSI_Bot to open long positions on each H4 candle if the STS_RSI_MTF_Indicator showed a value of 30 or less. The Bot opened a total of ...
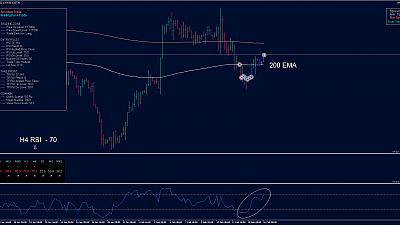
EUR/USD H4 long positions with STS RSI Bot
The EUR/USD currency pair is at support from 200 EMA on the H4 timeframe. The Month started with a strong upward movement after the oversold state on the Monthly Chart, where our STS_RSI_MTF_Indicator showed values below 30 for RSI 6 period. The price went above 200 EMA on the H4 chart and is currently testing it ...
EUR/AUD long positions closed with STS Zig Zag Bot
As we wrote in our Analysis earlier today, the EUR/AUD currency pair had the probability for long positions with our Zig Zag strategy. Initially we had loaded our STS_Zig_Zag_Bot on the M30 timeframe, but later we changed the settings to H1 timeframe. The Bot ...
EUR/AUD long positions closed with STS Zig Zag Bot
As we wrote in our Analysis from Feb 09, 2022, the EUR/AUD currency pair had probability for long positions. We loaded our STS_Zig_Zag_Bot on the M30 Timeframe to open long positions at a descending 12-period Zig Zag and close them at an ascending 20-period Zig Zag. The ...
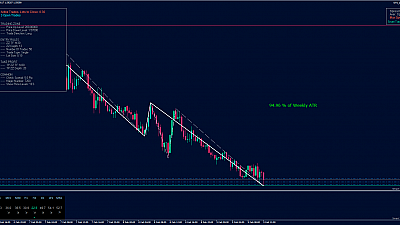
EUR/AUD long positions with STS Zig Zag Bot
The EUR/AUD currency pair has been in a Downtrend since the beginning of the Week. Currently, the STS_ATR_Distance_Indicator shows that the price has passed 95% of its weekly ATR (Average Weekly Movement for the last 6 Weeks). We expect the price to rise from current levels, so we charged our ...
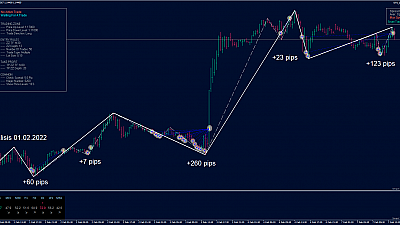
EUR/USD long positions closed with STS Zig Zag Bot
As we wrote in our Analysis from Feb 01, 2022, the EUR/USD currency pair was likely to make a series of profitable long trades with our Zig Zag strategy. We had loaded our STS_Zig_Zag_Bot to open long positions on each M30 candle in which we had a descending 12-period Zig Zag and close ...
EUR/USD long positions with STS Zig Zag Bot
The currency pair EUR/USD made a strong downward movement last month of almost 400 pips. This led STS_RSI_MTF_Indicator values to very low levels - currently the Monthly RSI is 28. This gives the possibility for two scenarios. 1. The current Month should be on in uptrend. 2. The current Mon ...
All Forex Signals 24.01 - 28.01.2022
See in the video below all our Forex trades for the week 24 - 28.01.2022, using our STS Bots . Get your STS_Zig_Zag_Bot now: https://smarttradingsoftware.com/en/expert-advisors/prd/sts-zig-zag-bot/ Get your STS_Zig_Zag_Tester now: https://smarttradingsoftware.com/en/market-testers/prd/sts-zig-zag-tester/ ...
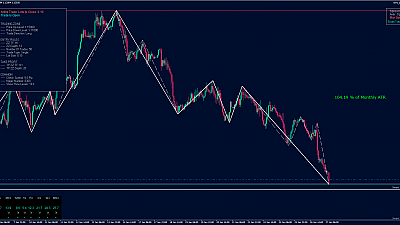
EUR/USD long positions with STS Zig Zag Bot
The EUR/USD currency pair is in the Support zone from the bottom from November and the Round number 1.12. STS_ATR_Distance_Indicator shows that since the beginning of the Month, the price has passed 104% of the monthly ATR (Average Monthly Movement for the last 6 months). STS_RSI_MTF_Indicator ...
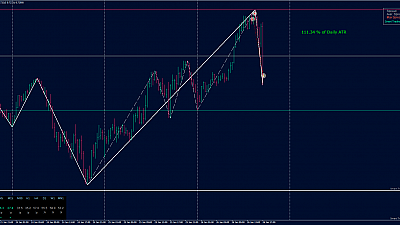
CAD/CHF 2 long positions closed with STS Zig Zag Bot
The currency pair CAD/CHF today made a strong upward movement and our STS_ATR_Distance_Indicator showed 100% of the Daily ATR (Average Daily Movement for the last 6 days). We loaded our STS_Zig_Zag_Bot to open short positions for each M30 candle in which we have an ascending 12-period ...