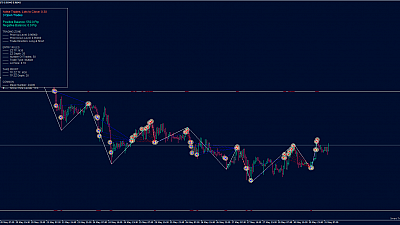
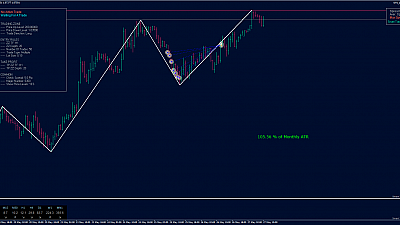
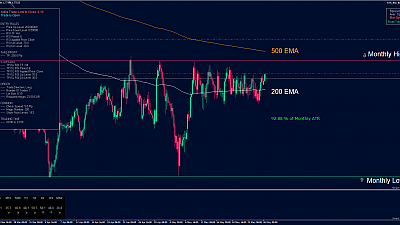
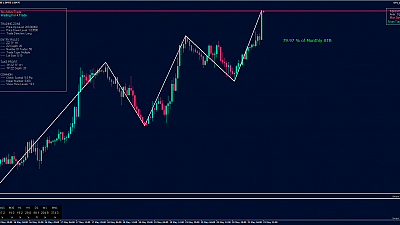
The currency pair USD/JPY made a strong upward movement in the first days of the new year and currently our STS_ATR_Distance_Indicator shows that we have passed almost 84% of the Weekly ATR (6 periods). The STS_RSI_MTF_Indicator shows that all Timeframes from M15 to Monthly are Overbought and with extremely high values, especially the largest - Monthly RSI - 79, Weekly RSI - 81, Daily RSI - 90.

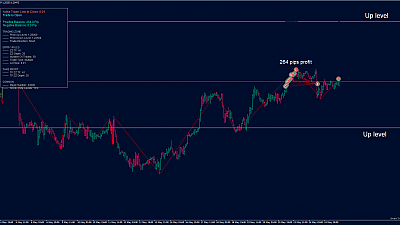
The STS_MA_Distance_Indicator also shows very large deviations from 10 EMA on the large Timeframes: Monthly - 364 pips, Weekly 182 pips, Daily 92 pips. All this gives us reason to expect the price to make a downward movement with a target of at least 10 EMA on a Daily Chart. That's why we loaded our STS_MA_Distance_Bot to open short positions on each Daily Candle if the distance to 10 EMA is 90 or more pips.

Visit our Forex Signals section to receive real-time trades from our Trading Robots. Get your FREE Forex Signals Plan now and follow our Forex Trading Signals for 30 days absolutely FREE.
Get your STS_ATR_Distance_Indicator now: https://smarttradingsoftware.com/en/indicators/prd/support-resistance-indicator/
Get your STS_MA_Distance_Indicator now: https://smarttradingsoftware.com/en/market-testers/prd/sts-ma-distance-tester/
Get your STS_RSI_MTF_Indicator now: https://smarttradingsoftware.com/en/indicators/prd/sts-rsi-mtf-indicator/
Get your STS_MA_Distance_Bot now: https://smarttradingsoftware.com/en/expert-advisors/prd/sts-ma-distance-bot/

