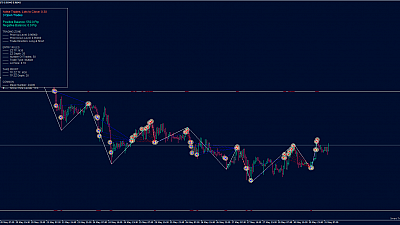
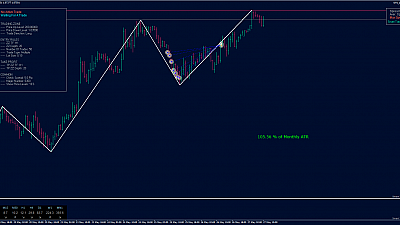
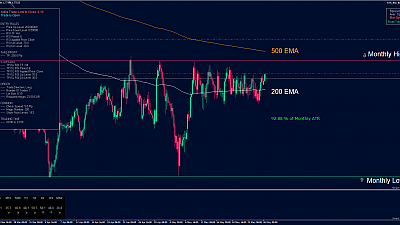
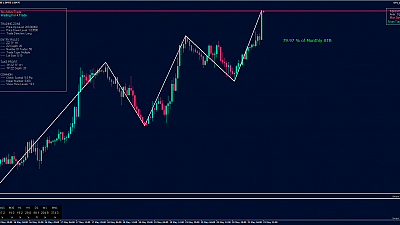
The currency pair GBP/CAD on Daily chart is in the Resistance zone of 200 EMA and 500 EMA. Our STS_RSI_MTF_Indicator with RSI 6 period settings shows overbought condition on all timeframes from M30 to Daily (M30-83, H1-87, H4-71, Daily-81). The STS_MA_Distance_Indicator shows a distance of 116 pips to 10 EMA.

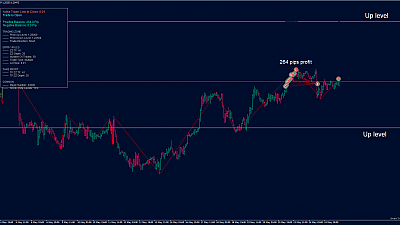
A Bearish Divergence is formed on the H4 timeframe and our STS_MA_Distance_Indicator shows 54 pips to 10 EMA. Because of these and the above arguments from the Daily Chart, we loaded our STS_MA_Distance_Bot to open short positions on each H4 candle if the distance to 10 EMA is 50 or more pips. The target that is set in the Trading Robot is 10 EMA from Daily chart.

Visit our Forex Signals section to receive real-time trades from our Trading Robots. Get your FREE Forex Signals Plan now and follow our Forex Trading Signals for 30 days absolutely FREE.
Get your STS_MA_Distance_Indicator now: https://smarttradingsoftware.com/en/market-testers/prd/sts-ma-distance-tester/
Get your STS_RSI_MTF_Indicator now: https://smarttradingsoftware.com/en/indicators/prd/sts-rsi-mtf-indicator/
Get your STS_MA_Distance_Bot now: https://smarttradingsoftware.com/en/expert-advisors/prd/sts-ma-distance-bot/

