XRP Holds $1.39 Support as SEC Commodity Ruling and ETF Deadline Reshape the Market
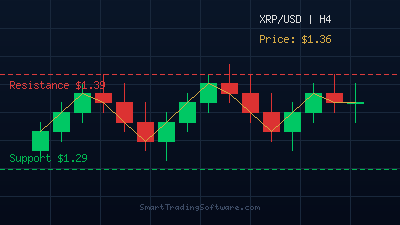
XRP is trading near $1.39 in late March 2026, consolidating within an ascending triangle pattern after a volatile quarter. The token reached $2.42 in early January before retracing sharply, and has spent recent weeks oscillating between $1.35 and $1.50. The March 17 SEC and CFTC joint classification of XRP as a digital commodity — ending more than four years of legal uncertainty — provided a fundamental catalyst, but price action remains cautious ahead of the March 27 deadline for the final batch of spot XRP ETF applications.
For traders watching this setup, the convergence of regulatory clarity, institutional ETF flows, and a well-defined technical range creates an ideal environment for automated strategies that can react to breakouts or rejections without hesitation.
Understanding the XRP Technical Setup
The daily chart shows XRP forming a tightening ascending triangle with higher lows pressing against resistance near $1.44–$1.50. The 20-day EMA sits at $1.43, currently acting as dynamic support, while the Supertrend indicator remains bearish with resistance around $1.66. The RSI reads 50.92 — a neutral zone that typically precedes a decisive directional move.
Key Support Levels
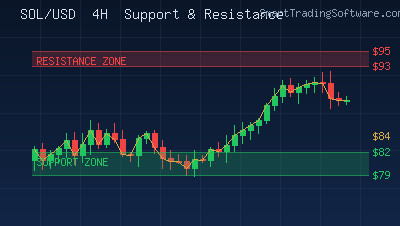
The primary support zone lies between $1.35 and $1.39, where buyers have stepped in consistently since mid-February. Below that, the Fibonacci 0.618 retracement at $1.32 marks a deeper structural floor. A break below $1.27 — the 23.6% Fibonacci level — would signal a shift toward bearish territory and potentially open the door to the $1.10 region.
Key Resistance Levels
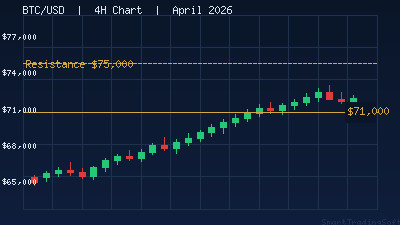
Immediate resistance is at $1.44–$1.45, where the daily high and Supertrend converge. The 3-day EMA50 at $1.51 is the next hurdle, followed by the weekly channel upper band near $1.61. A sustained close above $1.50 on strong volume would likely trigger momentum buyers and open a path toward the $1.80–$2.00 zone — the 2024 breakout level that now serves as major overhead supply.
Trading the Range: Strategy and Parameters
The current structure favors a range-trading approach until a confirmed breakout occurs. The plan is straightforward: buy near the $1.35–$1.39 support zone with stops below $1.32, targeting the $1.44–$1.50 resistance band. The risk-to-reward ratio at these levels sits near 1:2, which is favorable for systematic entries.
Entry Criteria
Look for bullish RSI divergence or a hammer candlestick pattern at the $1.35–$1.39 zone. Confirm with volume exceeding the 20-day average. For breakout traders, a daily close above $1.50 with RSI crossing above 60 signals the start of a potential trend leg higher.
Stop Loss and Take Profit
Place stops 2% below entry for range trades (around $1.32). First take-profit target sits at $1.44, second at $1.50, with a runner position targeting $1.61 if momentum accelerates. For breakout entries above $1.50, use $1.44 as your stop and target $1.80 as the primary objective.
Why Automation Gives You an Edge on XRP
The combination of an imminent ETF decision on March 27, fresh commodity classification, and a tightening price triangle means XRP could break sharply in either direction — potentially within minutes. Manual traders often hesitate at critical moments or miss overnight moves entirely. Automated trading bots execute instantly when your predefined conditions are met, removing emotion and capturing opportunities around the clock.
The Crypto Bot is built specifically for digital asset pairs and can manage XRP positions with precise entry triggers, dynamic stop-loss adjustments, and multi-target take-profit logic. For traders who want to validate their XRP strategy against historical data before going live, the Indicators Tester lets you backtest indicator combinations on past XRP price action to optimize your parameters.
If your strategy relies on RSI divergence signals — one of the most reliable reversal patterns for XRP at support — the RSI Divergence Bot automates the entire detection-and-execution process, scanning multiple timeframes simultaneously for divergence setups that human eyes might miss.
Key Levels to Watch This Week
The March 27 ETF deadline is the dominant catalyst. If the SEC approves the final batch of spot XRP ETFs, expect a rapid test of $1.50 and potentially $1.80 as institutional capital flows in — cumulative spot ETF inflows already exceed $1.44 billion. A delay or denial could trigger a pullback toward $1.32 or lower, though the commodity classification provides a fundamental floor that was absent in previous sell-offs.
Beyond the binary ETF event, watch the 20-day EMA at $1.43 as your short-term directional barometer. Sustained trading above it keeps the ascending triangle intact. A close below it on consecutive days would warn of a breakdown toward the triangle base near $1.32.
Getting Started with Automated XRP Trading
1. Analyze the XRP daily and 4-hour charts to identify whether price is at support, resistance, or mid-range. Current data puts us at the lower end of the $1.35–$1.50 range.
2. Backtest your preferred strategy using the Indicators Tester on XRP historical data to confirm positive expectancy before risking real capital.
3. Deploy the Crypto Bot on your MetaTrader platform with your tested parameters, setting clear support and resistance boundaries.
4. Monitor performance and adjust stop-loss levels as the ascending triangle resolves — tighten stops if a breakout above $1.50 is confirmed, or widen targets if the ETF approval drives momentum.
Have questions about configuring an automated XRP strategy for the current market conditions? Visit our contact page and the trading team will help you set up the optimal parameters for your risk profile.