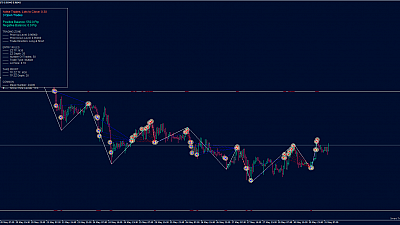
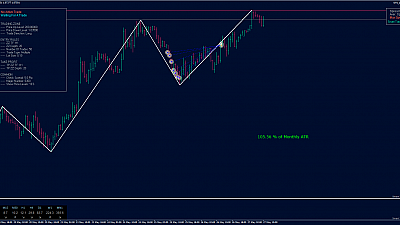
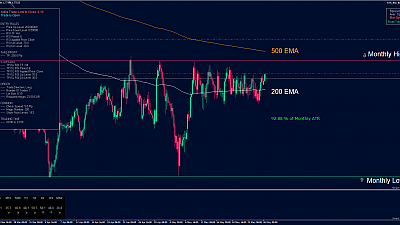
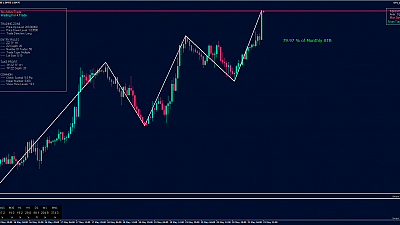
This is GBP/USD on a Daily chart. RSI 6 periods is in overbought territory.

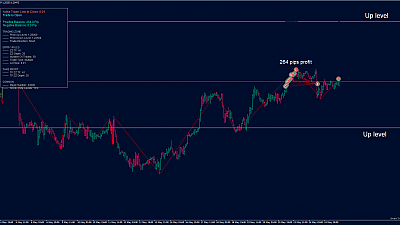
On H4 timeframe the Moving Averages show downtrend. RSI 6 period shows Bearish divergence and the probability for down movement is high. We have loaded our STS_MA_Distance_Bot to open a trade when our STS_MA_Distance_Indicator shows a distance of 50 or more pips to 10 EMA. The bot will open short positions on every H4 candle if the condition for 50 pips to 10 EMA is still met.

Visit our Forex Signals section to receive real-time trades from our Trading Robots.
