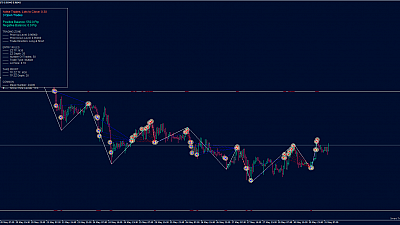
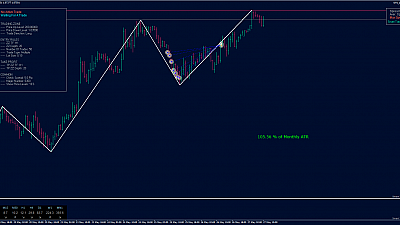
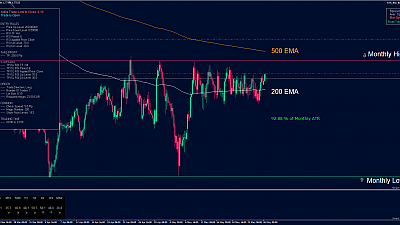
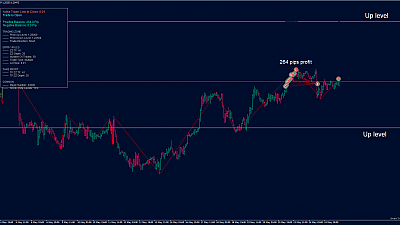
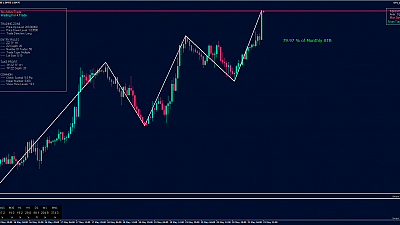
The currency pair GBP/USD on Weekly Chart is showing possibility for long positions.
1. We have a reverse candle from the previous week with value of RSI 6 periods below 30.
2. Current RSI 6 periods show an increase after crossing the level 30 from the bottom up.
3. Our STS_MA_Distance_Indicator shows 107 pips to 10 EMA.
4. Today is Friday - the last day of the week and it is very likely that the current Weekly candle will be "filled" with target 10 EMA.

On M15 Тimeframe, the Мoving Аverages are arranged parallel to one another and indicate an upward trend. We will open long positions if the price touches the Moving Averages during its correction.

Visit our Forex Signals section to receive real-time trades from our Trading Robots. Get your FREE Forex Signals Plan now and follow our Forex Trading Signals for 30 days absolutely FREE.

