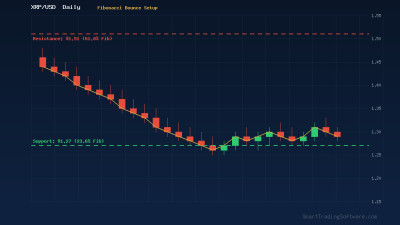
XRP Holds $1.27 Fibonacci Support as Q1 Closes — A Key Level for Swing Traders
XRP is closing the first quarter of 2026 at approximately $1.29, holding just above the critical $1.27 support level that aligns with the 23.6% Fibonacci retracement from the late-2024 breakout. After declining from its January highs near $1.60, XRP has settled into a consolidation range that many analysts view as a bear market support floor. The 200-day moving average sits near $1.38, and with monthly RSI hovering around 40 in neutral territory, the stage is set for a decisive move in early Q2.
This setup is particularly relevant for swing traders looking to capitalize on a potential bounce from well-defined Fibonacci support toward the $1.51 resistance zone — a level that coincides with the 61.8% Fibonacci retracement and would confirm a structural shift if broken convincingly.
Trading the Fibonacci Bounce: Entry and Risk Parameters
The current price action around $1.27–$1.30 offers a textbook Fibonacci bounce setup. The 23.6% retracement has held on multiple weekly closes, making it a high-probability support zone. Traders watching for confirmation should look for a daily close above $1.32 with increasing volume as an entry signal, which would suggest buyers are stepping in at this level.
Entry Criteria
A long entry becomes attractive when XRP reclaims $1.32 on a daily close, ideally accompanied by RSI crossing above 45 on the 4-hour chart. This level sits just above the current consolidation range and would signal momentum returning to the upside. For more aggressive entries, a bounce directly off the $1.27 level with a bullish engulfing candle on the daily chart can serve as an early trigger.
Stop Loss and Take Profit
A stop loss placed below $1.22 — roughly 20 pips beneath the Fibonacci support — provides adequate room for market noise while protecting against a breakdown. The first take-profit target sits at $1.42, the midpoint of the recent range, offering an approximate 1:1.5 risk-reward ratio from the $1.32 entry. A second target at $1.51 aligns with the 61.8% Fibonacci retracement, where on-chain data suggests limited resistance exists until the $1.76–$1.80 accumulation zone above.
Risk Management
Given crypto volatility, position sizing should limit exposure to 1–2% of account equity per trade. Scaling into the position — entering half at $1.32 and adding above $1.38 when the 200-day MA is reclaimed — can improve the average entry while confirming the trend shift.
Why Automated Execution Gives Traders an Edge
Fibonacci bounce setups require precise entry timing and disciplined stop management — exactly where human traders tend to struggle. Emotions like fear and greed often lead to entering too early, moving stops, or closing profitable trades prematurely. The STS Crypto Bot eliminates these issues by executing predefined strategies 24/7 without hesitation, which is especially critical in crypto markets that never close.
For traders who want to validate this Fibonacci retracement strategy before committing real capital, the STS Indicators Tester allows backtesting against historical XRP price data. You can test various Fibonacci levels, RSI thresholds, and stop-loss distances to find the parameters that have historically produced the strongest results for XRP specifically.
Additionally, the STS RSI Divergence Bot can detect bullish RSI divergences at support levels automatically — a pattern that frequently appears at Fibonacci retracements and signals a higher probability of reversal. Combining divergence detection with support-level entries can significantly improve the win rate of bounce trades.
Key Levels to Watch for XRP in Early Q2 2026
As the second quarter begins, several price levels will determine whether XRP resumes its uptrend or breaks down further. On the support side, the $1.27 Fibonacci level remains the line in the sand — a weekly close below this zone would open the path toward $1.13, which marks the next major support cluster. Below that, the $0.98–$1.00 psychological zone would represent a deeper correction back to pre-breakout levels.
On the upside, reclaiming $1.38 (the 200-day moving average) would be the first sign of a bullish reversal. A sustained move above $1.51 — the 61.8% Fibonacci retracement — would confirm the structural shift that many analysts are watching for. Beyond that, the $1.76–$1.80 zone contains approximately 1.85 billion XRP in accumulated positions, making it a significant resistance area that could cap gains temporarily before a push toward $2.00.
Seasonality data also favors bulls heading into Q2: historically, March has delivered an average 18% return for XRP over the past twelve years, and this positive momentum has often carried into April.
Getting Started with Automated XRP Trading
- Backtest your strategy — Use the STS Indicators Tester to validate the Fibonacci bounce setup on historical XRP data, adjusting entry levels and RSI thresholds to optimize performance.
- Configure the bot — Set up the STS Crypto Bot with your preferred entry at $1.32, stop at $1.22, and targets at $1.42 and $1.51. Enable the RSI filter to confirm entries only when momentum supports the trade.
- Deploy on a demo account — Run the strategy on a MetaTrader demo account for at least one to two weeks to verify execution in live market conditions before committing real capital.
- Monitor and adjust — Review the bot's performance as Q2 unfolds. If XRP breaks above $1.51, consider adjusting targets upward toward the $1.76 resistance zone.
Have questions about configuring the Crypto Bot for XRP or need help selecting the right parameters for your trading account? Contact our team — our analysts can help you tailor the setup to your risk tolerance and trading goals.