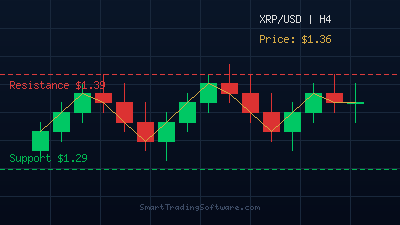
XRP Consolidates Near $1.36 as Bulls Eye the $1.39 Resistance
XRP is trading at approximately $1.36 in mid-April 2026, consolidating within a well-defined range after weeks of sideways price action. The token has held firm above the $1.29 support level while repeatedly testing resistance near $1.39. With the 14-day RSI sitting at 38.30 — just above oversold territory — and the MACD printing negative readings on the daily chart, momentum currently favors the bears. However, the accumulation pattern forming on the weekly chart suggests that a breakout toward $1.45 could be imminent if buyers reclaim the $1.39 level with conviction.
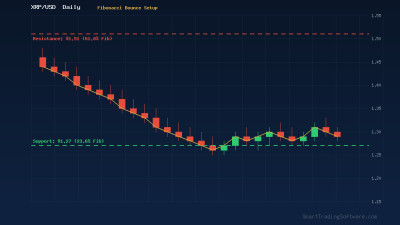
Trading the XRP Range: A Support and Resistance Approach
The current range-bound environment between $1.29 and $1.39 presents a textbook opportunity for a support and resistance trading strategy. Rather than chasing breakouts in either direction, traders can exploit the predictable bounces within this channel while keeping risk tightly controlled.
Long Entry Setup
Watch for price to pull back toward the $1.29–$1.31 support zone. Look for bullish confirmation signals such as a hammer candlestick, a bullish engulfing pattern, or an RSI divergence on the 4-hour chart. Enter long positions when these signals appear, with a stop loss placed at $1.26 — roughly 2% below the support floor. Set the initial take profit at $1.38, just below the $1.39 resistance, giving a reward-to-risk ratio of approximately 2.3:1.
Short Entry Setup
If price approaches the $1.39–$1.40 resistance zone and shows rejection signals — such as a shooting star candle, bearish divergence on RSI, or declining volume on the push higher — consider a short entry. Place the stop loss at $1.43 and target $1.30 for a favorable risk-to-reward of over 2:1.
Breakout Parameters
A daily close above $1.40 on increased volume would invalidate the range strategy and signal a potential move toward $1.45–$1.54. Conversely, a break below $1.29 with momentum could open the door to $1.25 or lower. In either scenario, the Support and Resistance Indicator can automatically plot these key levels on your MetaTrader chart, making it easier to spot when the range is breaking down.
Why Automate Your XRP Trading Strategy
Crypto markets run 24 hours a day, seven days a week. Manually monitoring the $1.29–$1.39 range around the clock is impractical for most traders. A missed bounce off support at 3 AM or a sudden breakout during a weekend session can mean the difference between a profitable trade and a missed opportunity.
The Crypto Bot is specifically designed for digital asset trading on MetaTrader platforms. It monitors price action continuously, executes entries at predefined support and resistance levels, and manages stop losses and take profits without emotional interference. For range-bound conditions like the current XRP setup, automated execution ensures you capture every bounce within the channel — not just the ones you happen to be watching.
If RSI divergence signals form part of your entry criteria, the RSI Divergence Bot can detect these patterns in real time across multiple timeframes and execute trades the moment your conditions are met.
Key XRP Levels to Watch This Week
The 50-day moving average sits at $1.3817, acting as dynamic resistance that aligns closely with the horizontal $1.39 level. This confluence zone makes a break above $1.40 particularly significant. On the downside, the $1.29 support has been tested multiple times since late March and remains intact. The 200-day moving average at $1.8823 is well above current prices, reminding traders of the broader bearish trend that has defined XRP since early 2026.
For the week ahead, the critical question is whether the $1.39 resistance gives way. A clean break and retest of this level as new support would target $1.45 initially, with $1.54 as the next major hurdle. Should support at $1.29 fail, expect a swift drop toward the $1.25 psychological level. Traders using the Indicators Tester can backtest both scenarios against historical XRP data to determine which outcome has better probability based on past behavior in similar setups.
Getting Started with Automated XRP Trading
1. Download MetaTrader 4 or 5 from your broker and connect it to a crypto-enabled account.
2. Install the Crypto Bot and configure it for XRP/USD with the support level at $1.29 and resistance at $1.39.
3. Use the Support and Resistance Indicator to visualize the key levels directly on your chart.
4. Set your risk parameters — a recommended starting point is 1-2% of account equity per trade.
5. Enable automated trading and let the bot monitor the range around the clock.
6. Review your results weekly and adjust parameters as the range evolves or breaks out.
Whether you are looking to capture range bounces or position for the next breakout, having the right tools running continuously gives you an edge in the fast-moving crypto market. Contact our team for personalized guidance on configuring your automated XRP trading setup.