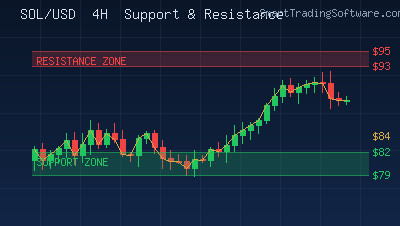
Solana Consolidates Near $84: A Range-Bound Opportunity
Solana (SOL) has spent much of April 2026 trading in a well-defined consolidation zone between $79 and $95, with the current price hovering around $84. After weeks of sideways movement, the token is sitting just above a critical support band at $79–$82, while facing concentrated resistance near $93–$95. The RSI stands at approximately 46, suggesting balanced momentum with neither bulls nor bears holding a decisive advantage. Meanwhile, the MACD is approaching a bullish crossover on the daily chart, hinting that selling pressure may be fading. For traders looking to capitalize on this range-bound environment, a structured support and resistance approach can turn indecision into profit.
Trading Solana’s $79–$95 Range: A Support and Resistance Strategy
Range-bound markets reward patience and precision. Rather than chasing breakouts that may not materialize, the current SOL setup invites traders to buy near the floor and sell near the ceiling of the established channel. The strategy centers on identifying high-probability entries at the $79–$82 support zone and targeting exits as price approaches the $93–$95 resistance cluster.
Entry Rules and Position Sizing
Look for bullish price action confirmations when SOL touches the $79–$82 support zone. This can include hammer candles on the 4-hour chart, bullish engulfing patterns, or a bounce confirmed by the RSI crossing above 40 from oversold territory. A conservative approach is to enter a long position at $82 with a stop-loss placed just below $76.50, which represents the March 2026 swing low. This gives a risk of roughly $5.50 per SOL. Position sizing should keep total risk to 1–2% of account equity per trade.
Take Profit Levels and Exit Strategy
The first take-profit target sits at $88, which corresponds to the mid-range level and a minor resistance from late March price action. A second target at $93 captures the upper portion of the range. Traders can scale out by closing 50% of the position at $88 and moving the stop-loss to breakeven on the remainder, letting the second half run toward $93–$95. If SOL breaks above $95.84 with strong volume, that signals a potential trend shift toward $105–$110 and traders may want to hold a portion for the extended move.
Short-Side Setups at Resistance
For those comfortable trading both directions, the $93–$95 zone offers short-entry opportunities. Bearish rejection candles at this level, combined with RSI readings above 65, provide a signal to sell with a target back toward $84–$85. A stop-loss above $97 keeps risk defined. This two-sided approach maximizes the number of opportunities within the range.
Why Automated Execution Makes a Difference
Range-bound strategies demand consistent execution at precise levels. Missing an entry by even a few dollars can turn a profitable setup into a losing one. Automated trading bots remove the emotional component and ensure orders fire exactly when conditions are met. The Crypto Bot is purpose-built for digital asset markets and can execute these range trades around the clock, even while you sleep. It monitors the $79–$82 support zone and the $93–$95 resistance in real time, entering and exiting positions according to predefined rules.
Pairing the bot with the Support and Resistance Bot adds another layer of precision. This bot specializes in detecting dynamic support and resistance zones and adapts as those levels shift over time. When SOL eventually breaks out of its current range, the bot adjusts automatically rather than continuing to trade a stale channel.
Key Levels to Watch This Week
The most important level on the downside remains $79. A daily close below this figure would break the range floor and open the door to a deeper correction toward $75–$77, where secondary support from the February lows comes into play. On the upside, $95.84 is the line in the sand. A decisive break and close above this level on increasing volume would confirm a bullish breakout and shift the bias toward the $105–$110 forecast zone that several analysts have highlighted for late April.
Within the range, $84 acts as a pivot. Price is currently oscillating around this level, and how it interacts with this mid-range marker can offer short-term directional clues. A sustained move above $84 favors the upper half of the range, while rejection here after a bounce from $79 suggests fading momentum.
Backtesting the Strategy Before Going Live
Before committing real capital, it is wise to validate the strategy against historical data. The Indicators Tester allows you to run support and resistance-based setups across months of SOL price history. You can measure win rate, average risk-to-reward, and maximum drawdown to build confidence in the approach before deploying it live.
Getting Started in Three Steps
1. Identify the current range boundaries on your SOL chart. Right now that means marking $79–$82 as support and $93–$95 as resistance on the daily and 4-hour timeframes.
2. Configure the Crypto Bot with the entry, stop-loss, and take-profit parameters outlined above. Set it to monitor the 4-hour chart for confirmation signals at both edges of the range.
3. Backtest the setup using the Indicators Tester to verify performance over the last three months of SOL data. Adjust position sizing and targets as needed based on the results.
Solana’s current consolidation will not last forever. Whether the breakout comes to the upside or the downside, traders who have a plan and an automated system in place will be best positioned to act. If you need help configuring any of the tools mentioned above, reach out through our contact page and the team will walk you through the setup.