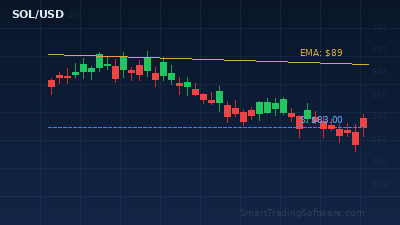
Solana Tests $83 Support as Bears Push Below Key Moving Averages
Solana (SOL) has slipped to the $82–$83 zone in late March 2026, falling beneath both the 20-day exponential moving average near $89 and the 50-day simple moving average around $87. After peaking above $86.90 earlier this week, selling pressure dragged the token toward its current level, where buyers are attempting to hold the line. Daily trading volume remains elevated at roughly $3.9 billion, a sign that market participants are actively positioning around this level rather than simply stepping aside.
The Relative Strength Index on the daily timeframe reads approximately 51, placing SOL in neutral territory. That mid-range RSI print is noteworthy because it means the market is neither overbought nor oversold, leaving room for a decisive move in either direction once a catalyst appears. Meanwhile, the daily MACD histogram shows a slight bearish divergence — price has stabilized, but upside momentum is thinning, which often precedes either a fresh breakdown or a sharp reversal once dip buyers absorb the remaining supply.
How to Trade the Solana Support Bounce Setup
The core idea behind this trade is straightforward: if the $80–$83 demand zone holds, a rebound toward the 20-day EMA near $89 — and potentially the $92 resistance cluster — becomes a high-probability scenario. A confirmed bounce here would represent a 7–11% move, offering a favorable risk-to-reward ratio for swing traders.
Entry Criteria
Wait for a four-hour candle close above $84.50 with rising volume, confirming that buyers are stepping in. Conservative traders may prefer to see RSI cross back above 55 on the same timeframe for added confirmation. Aggressive entries can be placed near $82.50 with a tight stop, but this approach carries more risk if the support zone fails.
Stop-Loss Placement
A stop-loss below $79.50 gives the trade enough breathing room beneath the psychological $80 floor. That level also coincides with the March swing low area, making it a logical invalidation point — a sustained break below $80 would signal deeper corrective potential toward $75.
Profit Targets
The first take-profit target sits at the 20-day EMA around $89, where overhead supply is likely. Traders who want to let profits run can scale out half their position at $89 and hold the remainder for a retest of the $92–$93 resistance zone, which has capped rallies multiple times this quarter.
Why Automated Trading Gives You an Edge on Crypto Volatility
Cryptocurrency markets trade around the clock, and Solana is especially prone to sharp overnight moves driven by ecosystem news, exchange listings, or broader risk-on/risk-off rotations. Manually monitoring a support-bounce setup at $83 means setting alarms, staring at charts, and reacting in real time — often while the best entries and exits happen during off-hours.
An automated trading bot eliminates that constraint. The Crypto Bot is built specifically for digital-asset pairs, executing entries and exits based on predefined rules around support, resistance, and momentum filters. It can place your $84.50 entry order, manage your stop at $79.50, and scale out at $89 and $92 without you lifting a finger — even at 3 AM on a Sunday.
For traders who prefer an RSI-centric approach, the RSI Divergence Bot is designed to spot exactly the kind of neutral-to-bullish RSI signals SOL is printing right now. It scans multiple timeframes, identifies divergence patterns between price and RSI, and enters positions automatically when the probability shifts in your favor.
Key Levels to Watch on SOL/USD This Week
From a structural standpoint, the levels below should be on every Solana trader’s radar heading into early April 2026:
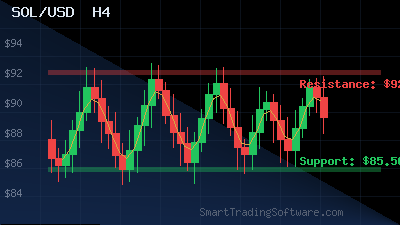
Support: The $82–$83 area is the immediate battleground. A clean break below $80 opens the door to $75, where the 200-day moving average is converging. Resistance: The first meaningful hurdle sits at $87, the 50-day SMA, followed by $89 (20-day EMA) and then $92–$93 which has acted as a ceiling through much of Q1. A daily close above $93 would flip the medium-term outlook decisively bullish and bring $98–$100 into play.
Volume profile data shows the heaviest traded node between $85 and $88, meaning a rally back into that range could meet some congestion, while a drop below $80 enters a lower-volume pocket that could accelerate selling.
Getting Started with Automated SOL Trading
1. Identify the setup: SOL trading near $83 support with neutral RSI — a textbook mean-reversion opportunity if support holds.
2. Choose your strategy: Use the Crypto Bot for a fully automated support-bounce approach, or the RSI Divergence Bot to trade RSI-based signals across multiple timeframes.
3. Backtest before going live: Run your parameters through the Indicators Tester on historical SOL data to validate the strategy before risking real capital.
4. Set your risk parameters: Define your lot size, stop-loss at $79.50, and take-profit targets at $89 and $92.
5. Deploy and monitor: Let the bot handle execution while you review performance at your convenience.
Have questions about which strategy fits your trading style? Reach out to our team through the contact page — we are happy to help you find the right setup for the current Solana market environment.