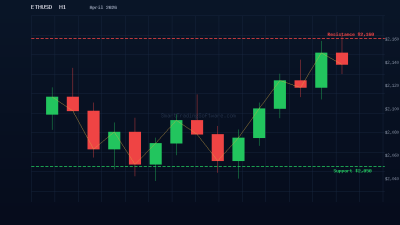
Ethereum Holds $2,050 Support as RSI Signals Oversold Conditions
Ethereum is trading near $2,124 as of early April 2026, consolidating within a tight range between $2,050 and $2,160 after weeks of subdued price action. The 14-day RSI currently reads 39.07 — hovering close to oversold territory — while the 50-day simple moving average sits at $2,126 and the 200-day SMA at $2,128. The MACD remains in negative territory, reflecting lingering bearish momentum, yet the price continues to hold above the key $2,050 support floor. For traders watching this setup, the confluence of oversold RSI readings and a well-defined support zone presents a potential bounce opportunity that can be captured systematically with automated strategies.
A Support-Based Bounce Strategy for ETH
The $2,050 level has acted as a reliable demand zone over recent sessions, absorbing sell-side pressure on multiple retests. A bounce strategy here focuses on entering long positions when ETH approaches this support with confirmation from momentum indicators. The idea is straightforward: wait for the price to dip into the $2,035–$2,055 zone, confirm that the RSI is below 40, and enter a long trade targeting the upper boundary of the current range near $2,160.
Entry and Confirmation Rules
A clean entry signal occurs when ETH's hourly candle closes above $2,055 after touching or wicking below $2,050, with the RSI turning upward from sub-40 readings. Volume confirmation — a noticeable pickup in buying volume on the bounce candle — adds conviction to the setup. Avoid entries if the price slices cleanly through $2,035 on heavy volume, as that signals potential breakdown toward the deeper support at $2,022.
Stop Loss and Take Profit Levels
A stop loss placed at $2,020 gives the trade enough breathing room below the $2,035 secondary support without risking excessive capital. The first take-profit target sits at $2,105, aligning with the overhead resistance cluster. A second target at $2,160 captures the full range move. Traders using the Crypto Bot can configure these exact parameters and let the algorithm handle execution around the clock — particularly useful when bounce setups trigger during off-hours or volatile overnight sessions.
Why Automation Matters at Key Support Levels
Support and resistance trades demand precise timing. A few seconds of hesitation can mean the difference between catching the bounce at $2,050 and chasing the move at $2,090. Manual traders often miss these entries because they happen fast and frequently occur outside regular trading hours. Automated strategies solve this by monitoring price levels continuously and executing the moment conditions are met.
The RSI Divergence Bot is particularly suited for setups like the current ETH configuration. When the price makes a lower low near support but the RSI prints a higher low, the bot detects this bullish divergence and enters automatically. Combined with the Support & Resistance Bot, which identifies and trades reactions at key horizontal levels, traders can build a layered approach that covers multiple entry scenarios without sitting in front of charts all day.
Key Levels to Watch for Ethereum in April 2026
On the downside, the primary support sits at $2,050, followed by $2,035 and then $2,022 — the level where a more meaningful correction could accelerate. On the upside, initial resistance stands at $2,105, then $2,160 at the top of the current consolidation range. A sustained break above $2,160 could open the door toward $2,250, which several analysts have flagged as the April target if buying pressure returns. Beyond that, the $2,300 zone marks the upper ceiling of broader forecasts for the month.
Traders who want to validate how these levels have performed historically can run backtests using the Indicators Tester — loading support and resistance strategies against past ETH data to see win rates, average profit, and drawdown before committing real capital.
Getting Started with This Strategy
1. Open a MetaTrader 5 chart for ETHUSD on the H1 timeframe and mark the $2,050 support and $2,160 resistance levels.
2. Load the Crypto Bot and configure the entry zone between $2,035 and $2,055 with the RSI filter set below 40.
3. Set the stop loss at $2,020 and take-profit targets at $2,105 and $2,160.
4. Run a backtest with the Indicators Tester over the last 3 months to confirm the strategy's edge on recent ETH price data.
5. Switch to a demo account first, then move to live once you are confident in the setup.
If you need help configuring any of these tools for your specific broker or account setup, reach out through our contact page — the team can assist with parameter tuning and installation.