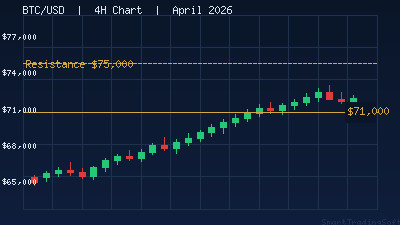
Bitcoin Reclaims $71,000 as Bulls Defend the $68K Floor
Bitcoin surged 3.8% on March 24, 2026, reclaiming the $71,000 level after bouncing convincingly from the $67,475 intraday low. The move pushed BTC back above its 50-day EMA near $72,568, a level that has acted as the dividing line between short-term bullish and bearish momentum since late February. With the 24-hour trading volume exceeding $23 billion and perpetual contract turnover above $427 million, the bounce carries real conviction â but the $72,500â$73,000 resistance zone remains the barrier that bulls must clear for a sustained move higher.
After dropping roughly 30% from its $100,000 cycle high in late 2025, Bitcoin has spent several weeks consolidating between $68,000 and $73,000. This type of range-bound price action rewards traders who can identify key levels and act quickly when breakouts or rejections occur â a task perfectly suited to automated trading systems that eliminate emotional hesitation.
Reading the Consolidation: RSI Divergence and Volume Patterns
The current Bitcoin structure on the daily chart shows a classic accumulation pattern. While price tested the $68,000 support twice in the past two weeks, the RSI formed higher lows â a bullish divergence that often precedes trend reversals. The RSI currently sits near 44.69, still in neutral territory, which means there is room for upside before reaching overbought conditions.
What makes this setup particularly interesting is the declining volume on sell-offs versus increasing volume on rallies. This volume divergence confirms that sellers are losing momentum while buyers are stepping in more aggressively at support. The MACD histogram on the daily timeframe is also flattening near the zero line, suggesting a potential bullish crossover is forming.
Key Entry Parameters for the Breakout
The primary bullish trigger sits at a daily close above $72,568, which is the current 50-day EMA. A confirmed close above this level would target the $78,000â$80,000 zone where the 100-day EMA provides the next significant resistance. Conservative traders may wait for a retest of the breakout level before entering, while aggressive traders can position on the initial close above with tighter stop-losses.
For the bearish scenario, a daily close below $68,000 would invalidate the accumulation thesis and open the path toward the deeper structural support between $63,000 and $65,000. This zone represents the most significant floor in the current cycle and would likely attract substantial buying interest from long-term holders.
Stop-Loss and Take-Profit Levels
For long positions triggered above $72,568, a stop-loss at $67,800 â just below the double-bottom support â provides adequate protection while allowing for normal intraday volatility. The first take-profit target sits at $78,000 (100-day EMA), with a secondary target at $80,000 for a risk-reward ratio of approximately 1:2.5. Traders running automated bots can implement trailing stops that lock in profits as Bitcoin moves through each resistance level.
Why Automation Gives You the Edge in Crypto Markets
Bitcoin's 24/7 market structure means breakouts frequently occur during overnight hours or over weekends when manual traders are away from their screens. The March 24 bounce from $67,475 to $71,269 happened within a single session â the kind of rapid move that rewards systems already positioned with limit orders and stop-losses in place.
The Crypto Bot is designed specifically for these conditions, monitoring BTC price action across multiple timeframes and executing trades based on configurable technical parameters. It can be set to trade the breakout above $72,568 automatically, with pre-defined stop-loss and take-profit levels that remove the guesswork from execution.
For traders who prefer confirmation through indicator divergences, the RSI Divergence Bot is an excellent complement. It scans for exactly the type of bullish RSI divergence forming on the current Bitcoin daily chart and generates entry signals when price and momentum alignment occurs. Combined with the Support & Resistance Bot, which identifies and trades reactions at key horizontal levels like the $68,000 floor and $72,568 EMA, you create a multi-strategy approach that captures different aspects of the same setup.
Key Levels to Watch This Week
Support Levels
Immediate support sits at $69,378â$71,840, which must hold for the bullish case to remain intact. Below that, $68,000 is the critical level â a daily close beneath it would shift the short-term bias to bearish. The deeper structural support between $63,000 and $65,000 represents the last line of defense before a more significant correction unfolds.
Resistance Levels
The first barrier is the 50-day EMA at $72,568, currently being tested. A decisive close above opens the path to $78,000â$80,000 where the 100-day EMA sits. Beyond that, the psychologically significant $80,000 round number would need to break before any retest of the $85,000â$90,000 range becomes realistic.
Getting Started with Automated Bitcoin Trading
- Open a MetaTrader 5 account with a broker that offers BTC/USD pairs with competitive spreads and adequate leverage for your risk tolerance.
- Install the Crypto Bot and configure it for the BTC/USD pair, setting the breakout trigger at $72,568 with a stop-loss at $67,800.
- Add the RSI Divergence Bot on a separate chart to capture momentum-based entries when the RSI bullish divergence resolves.
- Use the Indicators Tester to backtest your parameter settings against recent BTC price history before going live.
- Monitor performance weekly and adjust parameters as the $68,000â$73,000 range either breaks out or contracts further.
Whether Bitcoin breaks above $72,568 to target $78,000 or retests the $68,000 floor for a third time, having an automated system in place ensures you capture the move regardless of when it happens. For questions about configuring these bots for your specific trading setup, reach out through our contact page and our team will help you get started.