Bitcoin Consolidates Near $71,000 as the Market Eyes a $75,000 Breakout
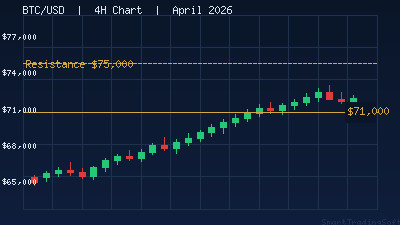
Bitcoin (BTC/USD) is trading at approximately $71,000 as of April 9, 2026, following an impressive 6.6% weekly gain that has brought it back into a key decision zone. After months of choppy price action, BTC has re-established momentum above the $68,770 support level — a zone that held firm through multiple tests in March. The question now is whether bulls can sustain pressure to crack the $73,175 intermediate resistance and, ultimately, challenge the psychologically significant $75,000 barrier.
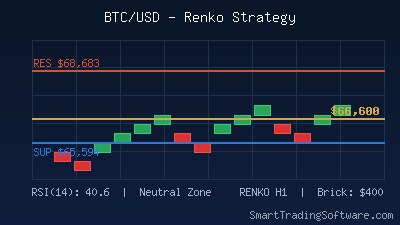
The RSI on the daily chart sits around 54–58, firmly in neutral-to-bullish territory. This reading is significant: it suggests that momentum is rebuilding without the overbought conditions that typically precede sharp reversals. Meanwhile, MACD momentum has stalled on the bearish side, hinting that the next directional move is likely to the upside if volume supports the breakout attempt.
The RSI Divergence Strategy for BTC in Current Conditions
One of the most reliable setups in the current Bitcoin environment is the RSI divergence play on the 4-hour and daily timeframes. When price consolidates or makes a marginal new low while the RSI forms a higher low, the divergence signals that selling pressure is exhausted and a reversal — or continuation of the prior uptrend — is imminent. This is exactly the structure Bitcoin has been painting heading into mid-April 2026.
Traders watching the $68,770 area have already seen two instances of bullish RSI divergence form as price tested and rejected that level. Each test printed a lower price low, while RSI carved out a higher low — a textbook divergence signal. The third touch of this zone failed to materialize, and BTC bounced decisively, adding to the conviction that the support floor is solid.
Entry Parameters
For traders looking to enter on a continuation setup, the ideal entry zone sits between $70,200 and $71,500. A pullback into this band — particularly if accompanied by an RSI reset toward the 45–50 range — represents a high-probability long entry with a well-defined risk level. Aggressive traders may consider entering on a confirmed 4-hour close above $71,800, which would signal that the short-term consolidation has resolved to the upside.
Stop-Loss and Take-Profit Levels
The logical stop-loss for this setup sits just below the $68,200 level — a clear break below here would invalidate the bullish thesis and expose BTC to a deeper correction toward $65,737. On the upside, the first target is $73,175, where significant selling pressure has historically clustered. A clean break above $73,175 opens the path toward the $75,000 target, and a sustained move beyond $75,000 could trigger algorithmic buying programs that push BTC into the $78,000–$80,000 range by late April. The risk/reward for this setup is approximately 1:2.5 to 1:4, which aligns well with systematic trading strategies.
Timeframe and Confirmation
The daily chart provides the primary trend context — bullish above $68,770. The 4-hour chart is the best execution timeframe for this strategy, as it filters out the noise of lower timeframes while still providing timely signals. Confirmation of entries via RSI hooks from neutral territory (45–55 range) adds an important layer of reliability to each trade signal.
Why Automated Trading Suits Bitcoin's Volatility
Bitcoin is notorious for moving fast — sometimes surging or dropping 5–10% within hours. Manual trading in this environment is exhausting and error-prone: emotions kick in at exactly the wrong moment, leading to premature exits or missed entries. Automated trading systems eliminate this problem by executing pre-defined logic with precision, day and night, regardless of market hours or trader availability.
The RSI Divergence Bot (€421) is purpose-built for setups exactly like the current BTC configuration. It continuously scans for RSI divergence across multiple timeframes, triggers entries when the divergence structure is confirmed, and manages exits based on pre-configured take-profit and stop-loss levels. The bot handles everything from signal detection to order execution — no manual intervention required.
For traders who prefer a rules-based approach anchored to market structure rather than oscillators, the Support & Resistance Bot (€211) is an excellent complement. It identifies key S&R zones algorithmically and executes trades when price interacts with those zones in a defined manner — precisely the kind of behavior Bitcoin is exhibiting at the $68,770 and $73,175 levels right now.
If you want to validate any RSI-based strategy before deploying it on live capital, the Indicators Tester (€155) allows you to backtest indicator-driven logic against historical BTC price data. You can optimize RSI parameters, divergence detection thresholds, and risk settings across thousands of historical candles — so you know exactly how a strategy would have performed before risking a single euro.
Key Levels to Watch on Bitcoin in April 2026
Understanding where the most important price levels sit is critical for navigating BTC's upcoming moves. Here is the current technical map:
Support levels: $70,000 (psychological + short-term pivots), $68,770 (major structural support), $65,737 (secondary support / deeper pullback target).
Resistance levels: $71,800 (immediate intraday resistance), $73,175 (key swing resistance), $75,000 (major psychological and technical resistance), $78,000–$80,000 (extended breakout targets if $75K clears).
The $75,000 level is the critical line in the sand for April. A sustained daily close above it — ideally on above-average volume — would signal a strong shift in market sentiment and likely trigger a fresh leg higher. Conversely, a rejection at $73,175 with BTC closing back below $71,000 would indicate that the consolidation is unresolved and more sideways to bearish action is ahead before any breakout attempt.
Getting Started: Trade This Bitcoin Setup with STS Tools
If you want to take advantage of the current RSI divergence opportunity on Bitcoin without spending hours glued to the charts, here's how to get started with SmartTradingSoftware's automated tools:
- Choose your bot: The RSI Divergence Bot is the most direct match for the current setup. It's compatible with MetaTrader 4 and 5, and works with any BTC/USD broker feed.
- Backtest first: Use the Indicators Tester to validate RSI parameters on historical BTC data. Start with a 14-period RSI and test divergence detection across the 4H and daily timeframes to find the best settings for current market conditions.
- Configure risk management: Set the stop-loss just below $68,200 and use the tiered take-profit levels at $73,175 and $75,000. The bot handles order sizing automatically based on your account equity and risk percentage settings.
- Deploy on a demo account first: Run the bot on a demo account for at least one week to confirm live performance matches backtest results before switching to a live account.
- Monitor key events: Keep an eye on macroeconomic releases (US CPI, Fed speeches) that can cause sharp BTC moves — the bot's built-in drawdown limiter will protect capital during high-volatility events.
Ready to automate your Bitcoin trading strategy? Visit our contact page to get personalized guidance on configuring the right bot for your trading style and risk profile. Our team is available to help with setup, optimization, and ongoing strategy refinement.