Bitcoin at $66,600: Navigating a Tight Consolidation with Renko Charts
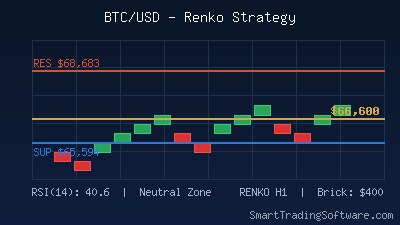
Bitcoin (BTC/USD) is trading at approximately $66,600 on March 29, 2026, caught in a well-defined consolidation range between key support at $65,594 and resistance at $68,683. The RSI(14) sits at 40.6 — neutral territory that neither confirms a bullish recovery nor signals outright weakness. MACD is beginning to shift positive, pointing to a slow fade in selling pressure, but geopolitical headwinds and rising energy costs continue to weigh on risk appetite across crypto markets.
For active traders, this kind of tight range can be frustrating on standard candlestick charts — noise fills every bar and whipsaws punish both bulls and bears. That is precisely where Renko charts offer a decisive edge. By filtering out time and focusing purely on price movement, Renko bricks reveal clean structure that standard charts obscure, making breakout and reversal signals far easier to act on with confidence.
Why Renko Charts Work for Bitcoin Range Trading
Renko charts build new bricks only when price moves a fixed amount in one direction. For BTC/USD at current volatility levels, a brick size between $300 and $500 captures the meaningful swings while ignoring minor intraday noise. The result is a chart that makes the current $65,594–$68,683 range unmistakably clear: two solid levels where price has repeatedly reversed.
The trading logic on Renko is straightforward. A sequence of green bricks forming above the $66,700 pivot confirms buying momentum. A red brick close below $65,600 signals that sellers have regained control. There are no ambiguous wicks, no half-formed candles — just clean directional conviction represented as solid blocks.
Entry Parameters for the Range Play
For a long bias entry, traders look for three consecutive green Renko bricks forming above the $66,700 level with RSI crossing above 45 from the neutral zone. This combination confirms that both price momentum and momentum oscillator are aligned. A conservative entry at $67,000 targets the upper boundary of the range near $68,500, giving a clean 1,500-point reward potential.
Stop Loss Placement
The most logical stop on the Renko chart sits one brick below the entry signal — approximately $65,200 for longs, just below the established support cluster. This reflects the principle that if price forms a red brick below the last green sequence, the signal has failed and capital should be protected immediately. Risk per trade should not exceed 1–2% of total account value regardless of conviction level.
Take Profit Levels
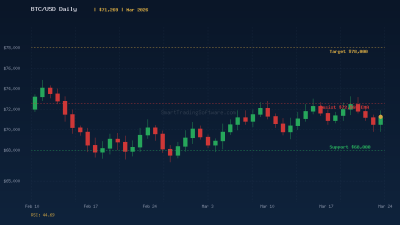
The primary target sits at $68,500, the upper range boundary that has capped rallies multiple times in recent sessions. A secondary target at $70,000 becomes relevant only if Bitcoin prints a confirmed breakout above $68,683 on high volume — the level that, if broken, invalidates the current consolidation pattern and opens a potential move toward $72,000 based on the measured move from the range height.
How Automated Renko Trading Removes Emotional Bias
One of the biggest challenges manual traders face in range conditions is the temptation to overtrade. Every minor spike to support or resistance feels like a setup, leading to premature entries and unnecessary losses. Automation resolves this entirely.
The Renko Bot for MetaTrader by SmartTradingSoftware executes trades based on Renko brick signals with zero emotional input. The bot monitors brick formation in real time and triggers entries only when predefined conditions are met — consecutive green or red bricks combined with optional RSI or MACD filters. It runs 24/7 without fatigue, which matters enormously in crypto markets that never close.
For traders who want to combine Renko signals with RSI divergence as an additional confirmation layer, the RSI Divergence Bot captures hidden divergence patterns where price makes a lower low but RSI prints a higher low — a classic signal of exhausted selling that often precedes sharp reversals from key support levels exactly like the current $65,594 zone.
For a pure support-and-resistance approach without the complexity of Renko construction, the Support & Resistance Bot automatically identifies dynamic levels and places orders at the boundaries — ideal for trading the defined $65,594–$68,683 range mechanically without manual level-drawing.
Key Levels to Watch on Bitcoin This Week
The most important level on the chart right now is $66,700 — the intraday pivot that has separated buyers and sellers in the past several sessions. A hold above this level on the daily close keeps the bullish range scenario intact. A daily close below $65,594 flips the outlook toward a retest of the $62,300 demand zone, which analysts have identified as the next major support if the current consolidation resolves downward.
To the upside, the $68,683 level is the near-term gatekeeping resistance. Price has tested this ceiling twice without a sustained break. A third test with expanded volume and RSI pushing toward 55 would represent a credible breakout setup. Above $68,683, the next technical target zone is $70,000–$71,300, where Bitcoin faces the next cluster of overhead supply from January 2026 distribution.
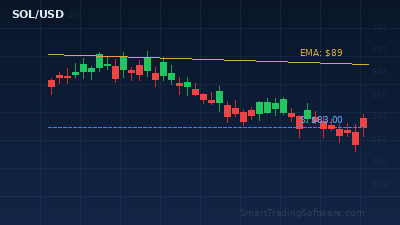
The broader technical picture shows BTC trading below its 200-period EMA on the daily chart, which keeps the medium-term trend technically bearish. However, MACD histogram bars are shortening on the daily timeframe — a sign that the downside momentum that has characterized price action since the February highs is gradually losing energy. This is consistent with the neutral RSI reading and supports a wait-for-confirmation approach rather than aggressive directional positioning.
Getting Started with Automated BTC Range Trading
- Identify your brick size. For BTC/USD in current market conditions, a Renko brick size of $400–$500 on the H1 chart strikes the right balance between responsiveness and noise reduction. Too small and the brick fires on every minor fluctuation; too large and you miss the key reversals within the range.
- Set your levels. Mark $65,594 as hard support and $68,683 as hard resistance on your Renko chart. These are the boundaries that price has respected and where the highest-probability reversal signals are generated.
- Choose your automation tool. The Renko Bot for MetaTrader 4/5 handles the brick calculations and order management automatically. Install it, configure your brick size and account risk percentage, and let it monitor the market round the clock.
- Backtest before going live. Use the Indicators Tester to validate the Renko strategy against historical BTC/USD data. Running backtests over the past 90 days will show how the current range setup has performed in similar low-RSI consolidation environments.
- Apply strict risk management. Even the cleanest technical setup fails sometimes. Keep position size consistent and honor your stop levels regardless of conviction. The advantage of automation is that it removes the temptation to move stops during a drawdown.
Bitcoin's current consolidation between $65,594 and $68,683 offers a well-defined playground for systematic Renko traders. With RSI neutral, MACD turning, and both support and resistance clearly mapped, the technical setup favors a rules-based approach over discretionary guesswork. If you want to explore how automated Renko strategies can work for your BTC trading, get in touch with our team — we are here to help you build a setup that fits your risk profile and trading goals.