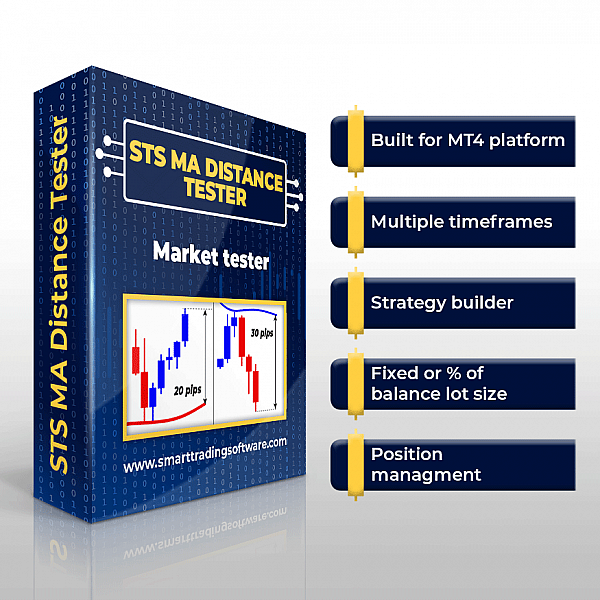
The right way to choose a strategy is to test it on historical data to get the exact success rate and statistics for it. That is why we at smarttradingsoftware.com developed an MT4 Tester for the MA_Distance_Strategy. We use it ourselves every day to see if the current trade is more likely to be a winner or loser based on the previous positions traded with the same strategy.
The MA_Distance_Tester is designed to open positions when the current price moves away from a pre-selected Moving Average and to close them when the price touches the same or another pre-selected MA. You can set the price range, in which the robot will work, the timeframe, the period of the Moving Average, the period and timeframe of the MA for the take-profit rules. You choose to open short positions only, long positions only or both types. There is the option to trade one situation or several and open 1 or up to 10 positions at a time. You can optimize your strategy to find the best settings for the strategy parameters and the fittest candidate for live trading.
When you backtest a strategy it is good to keep in mind that setting up a Tester is different from setting up an Expert Advisor. Both will facilitate and optimize your trading. But while in real-trading your aim is to protect the open positions as good as possible, in backtesting this would rather harm the results. The idea of backtesting is to see the real potential of your strategy and this certainly includes the losing trades. You must let all trades develop fully, so that you can grasp the cycle of wins and losses. Also, the longer the testing period, the better. As with everything else, to get reliable results, you need to process as much data as possible.
Example:
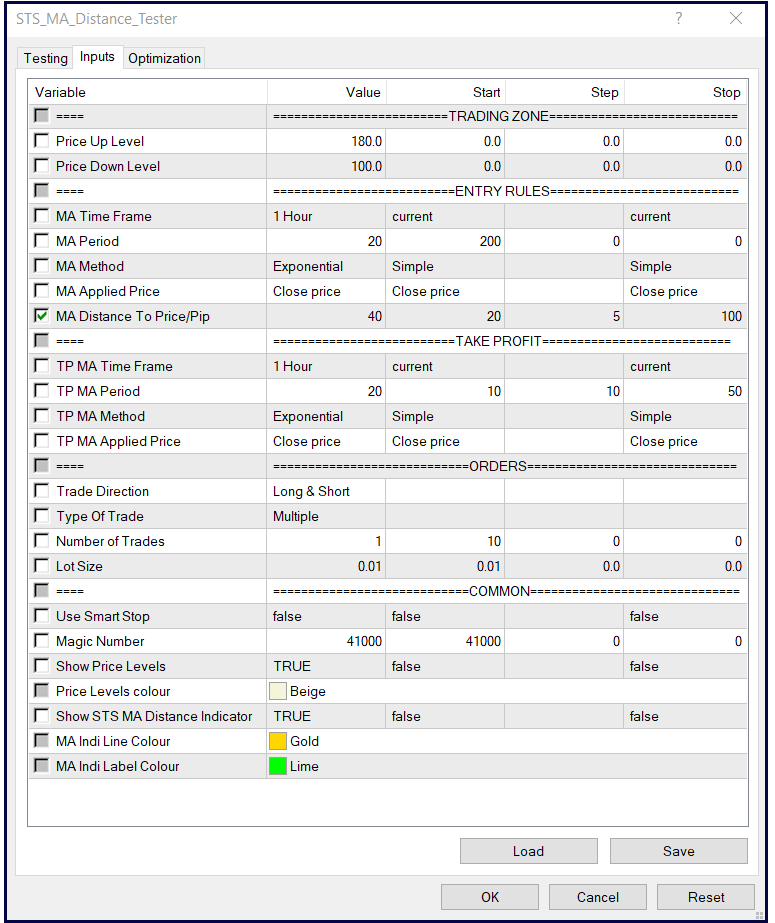
This is the currency pair GBPJPY on H1 timeframe. The trading zone is wide. The Up and Down levels are the boundaries that serve as stop-loss levels for the open trades, so setting them further from each other guaranties that the positions will not get closed upon reaching them. Smart Stop is set to False for the same reason. As we said, it is important to see how bad and frequent the losing trades are. Type of Trade is Multiple, which means that the Tester will trade throughout the whole defined period. Number of Trades is 1, so the Tester opens just one position for every trading situation.
Report:
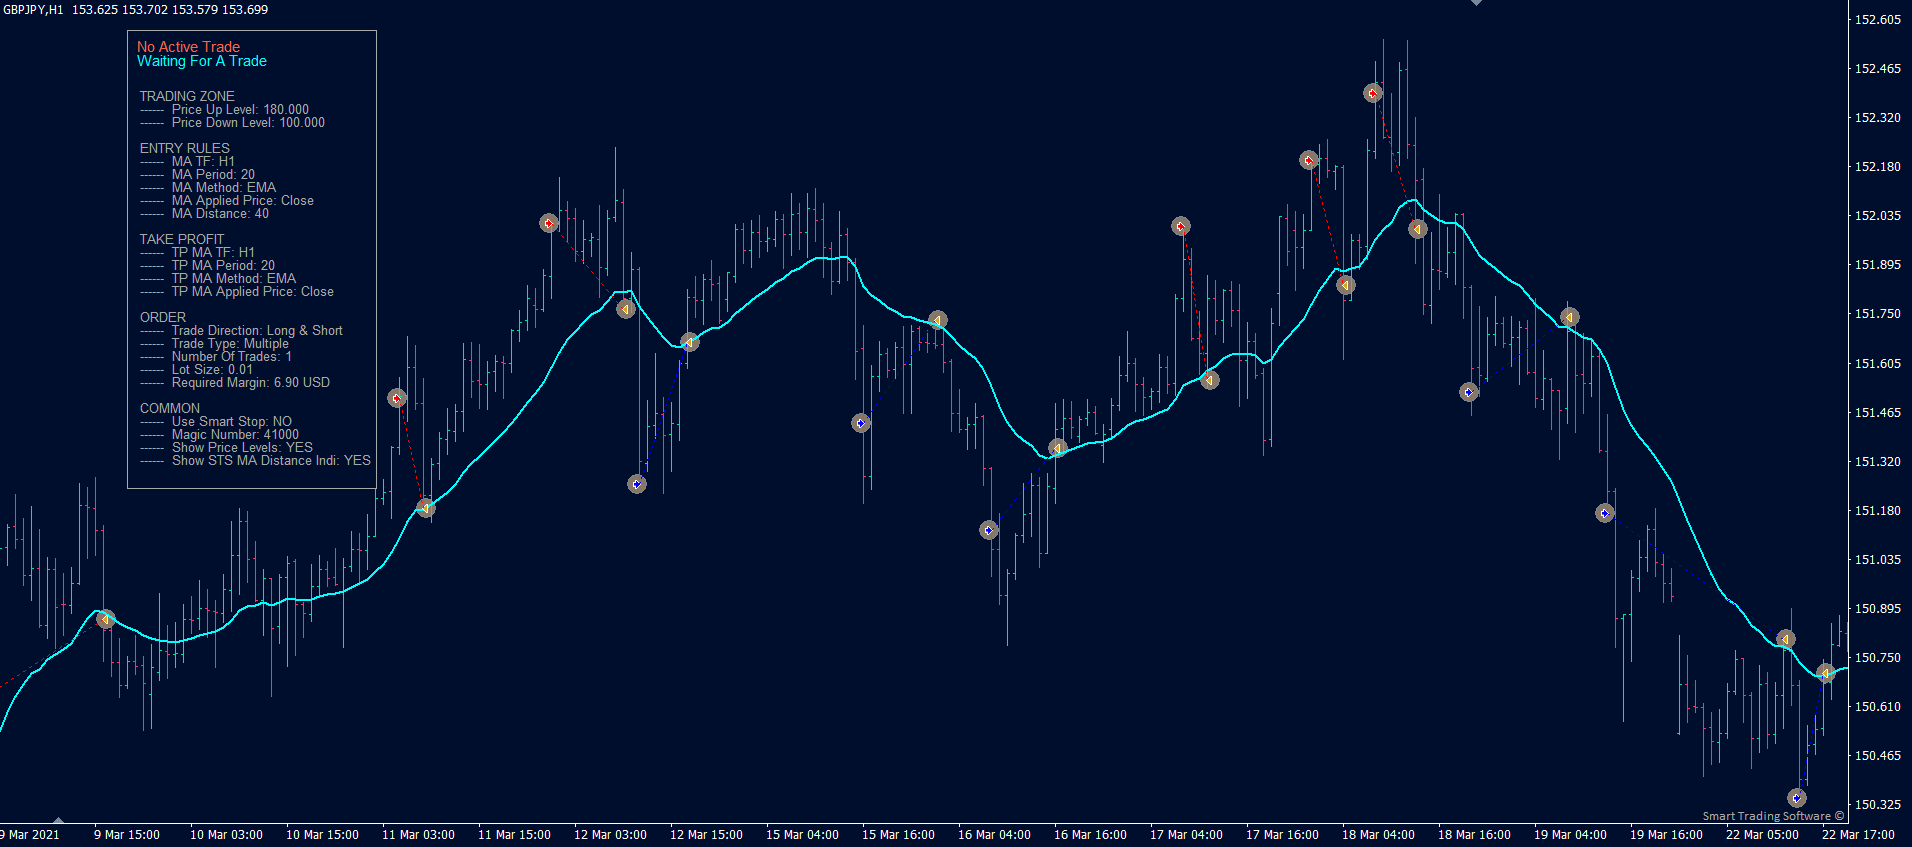
The Report is the summary of all the trades that the Tester performed during the backtest. There are some important pieces of data that you should pay close attention to. The first is the Profit trades and their percentage of the total number of trades. Of course, the higher the figures, the better. Then check out the Maximum consecutive profit and loss trades. A big difference between the two numbers (in favor of the winning trades) is a good signal that the strategy produces stable profit. Another point is to pay attention to how many consecutive loss trades this strategy has had. If you have backtested on a big enough period of time, it is safe to consider this number as the probable maximum of consecutive losses in real-trading with this strategy and these parameters. The figures for wins and losses are also displayed as average value and count, which further prepares us for what we can expect.

Back to our example, we can clearly see two of the cycles for this strategy. They fully correspond to the statistics with the large count of winners and after them the single loss. Keep in mind that whenever you see a winning streak, you are imminently getting closer to that losing trade. Unfortunately, no strategy can produce only wins.
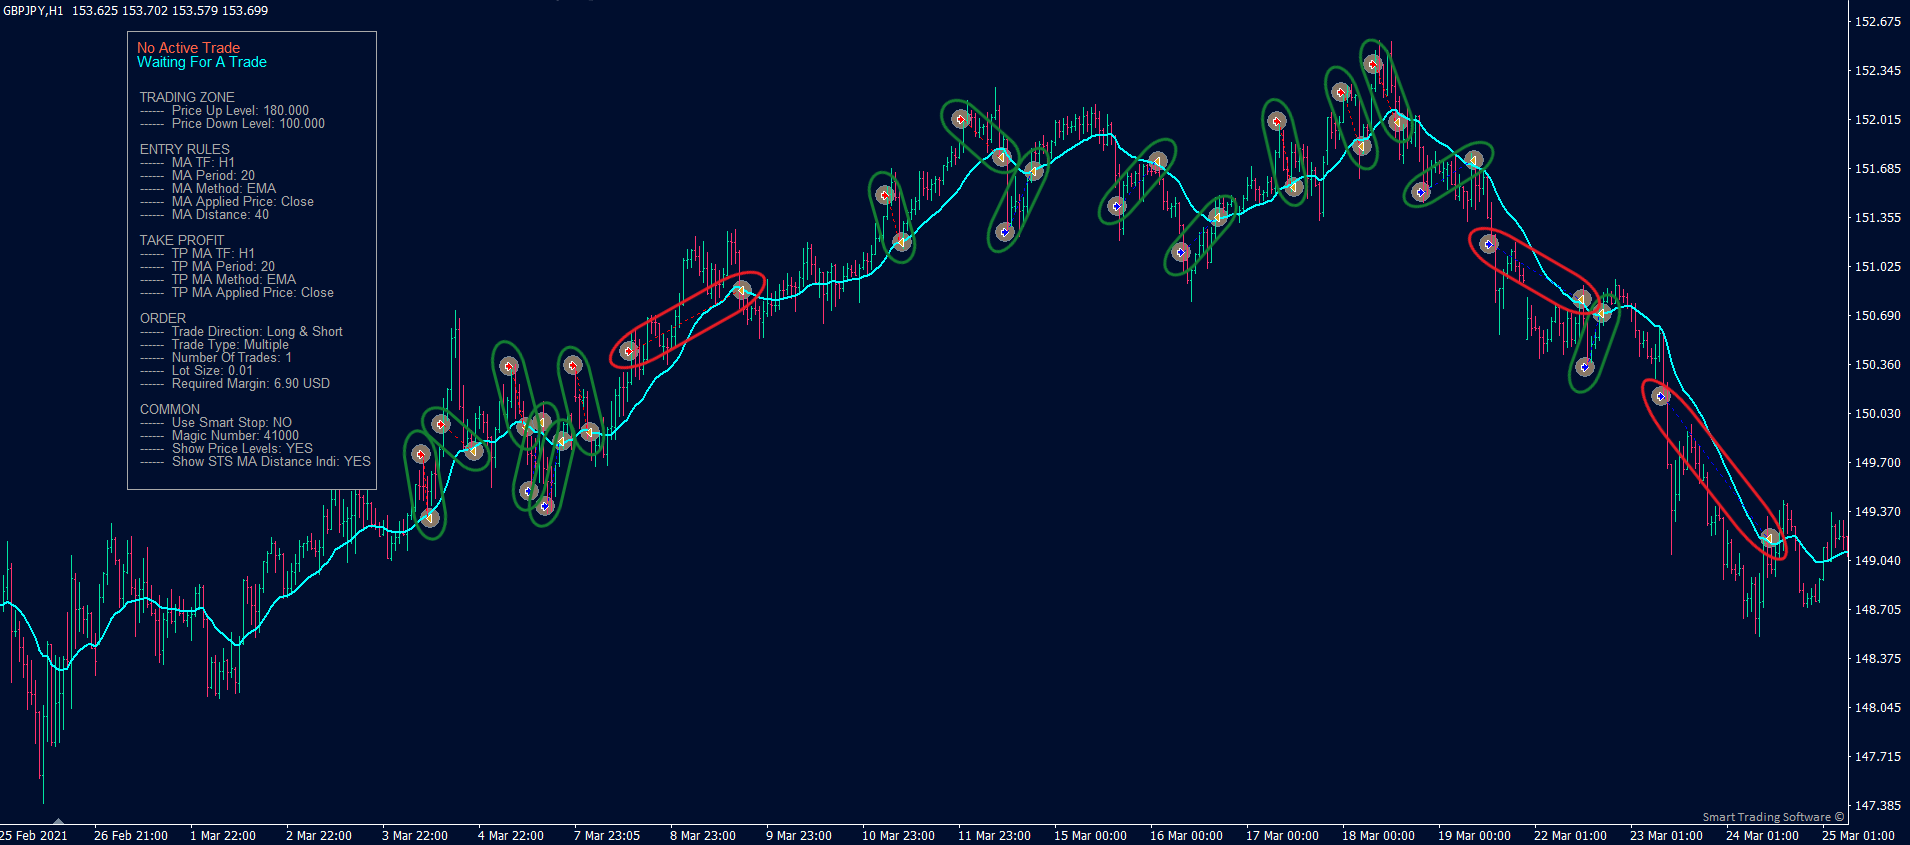
Next, we take a look at the three consecutive losses. Because statistics tell us that the Maximum consecutive losses for this strategy is 3, there is good probability that the next position will be a win.
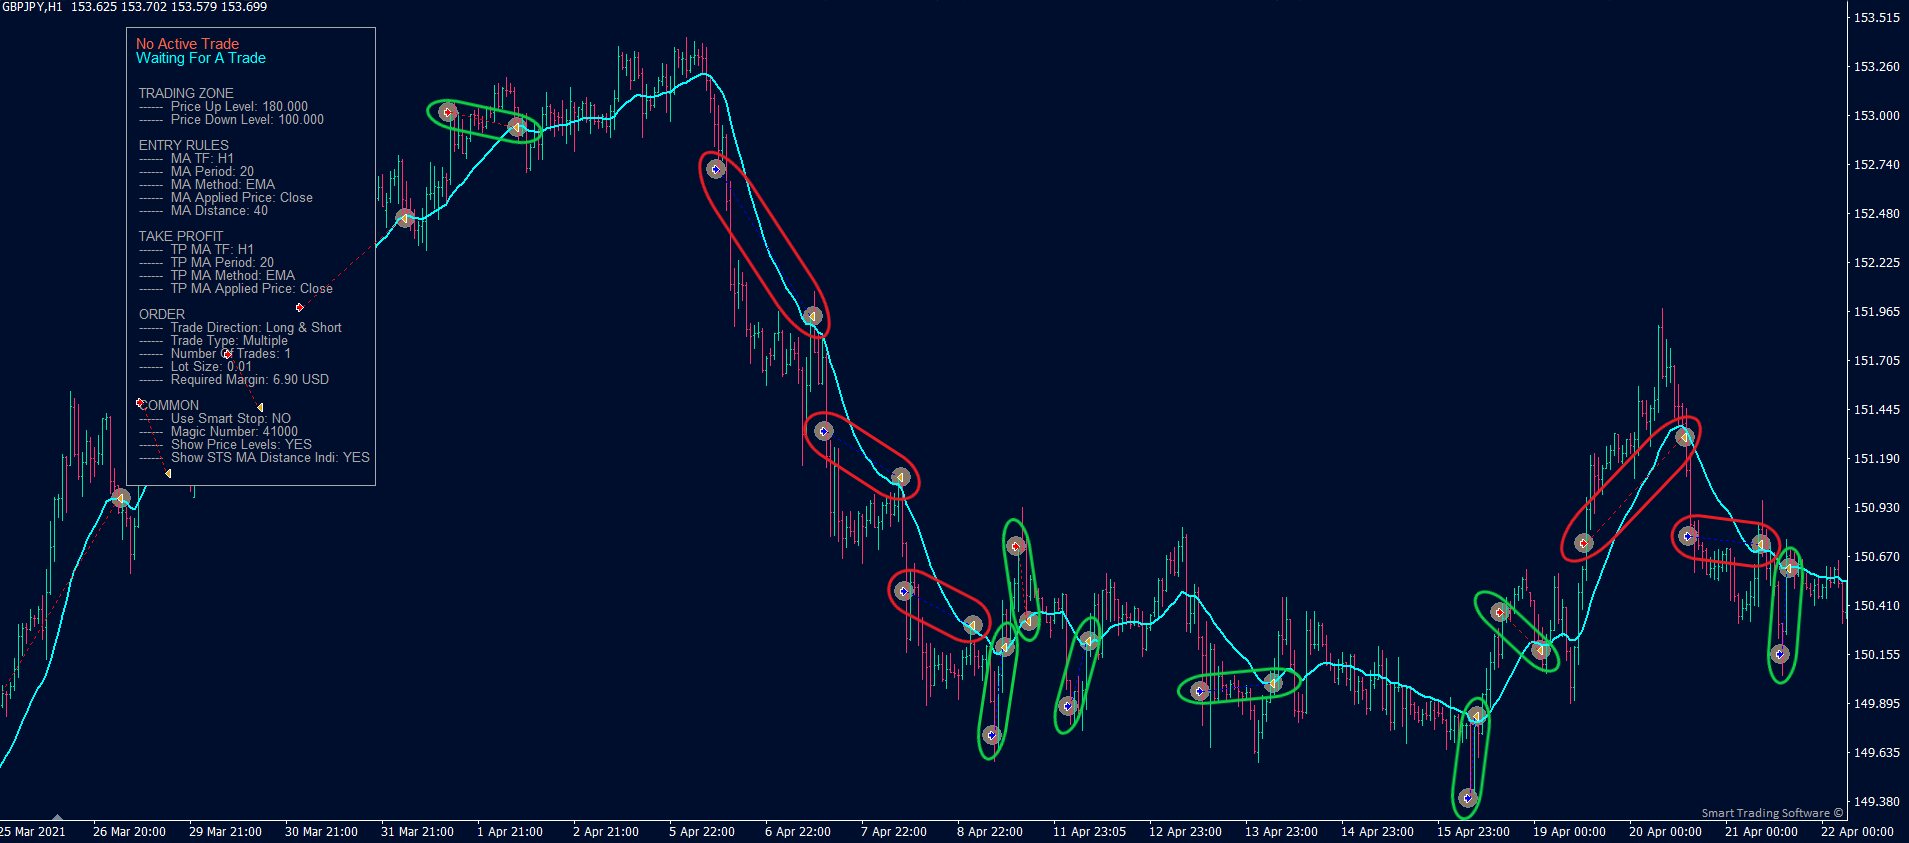
We use the MA_Distance_Tester in our everyday trading. When we see a good trading opportunity we backtest this set-up to see what the previous trades would have been and how they would have developed. Knowing the statistics of this strategy, the results indicate the probability for the outcome of the new situation. If there were some winning trades, their count getting close to the average or maximum consecutive wins, we are on the alert that this might be the losing trade of the cycle. If, on the other hand, the previous position was closed for a loss, this gives us confidence to expect a winning trade ahead.
Optimization:
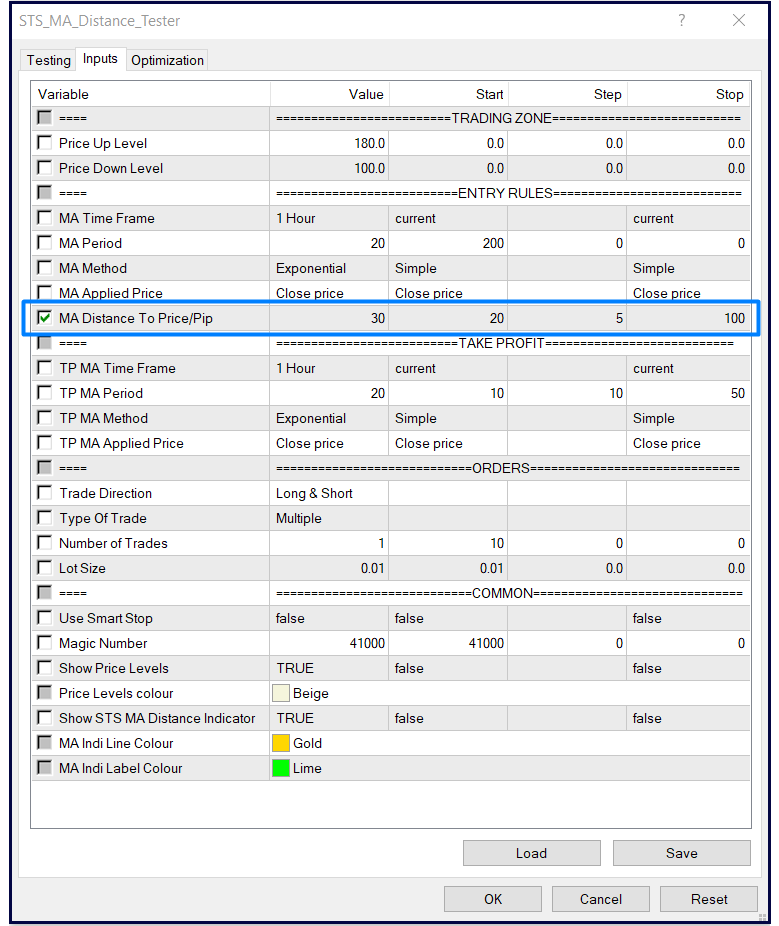
Optimization can be used for developing or fine-tuning a strategy. The best way to optimize the MA_Distance_Strategy is to try different values for the distance between the current price and the MA (this distance holds the profit of the position).
This is the currency pair EURJPY on H1 timeframe. We are optimizing to find the best distance for opening positions. Start is the starting value, Stop is the end value and Step sets the difference in the value of the optimized parameter in the variants that will be tested. If we set Start at 20, Stop at 100 and Step at 5, the Tester will run the following combination for distance:
20, 25, 30, 35, 40 … 95, 100 - or 17 combinations total.
We then inspect the results from all tested combinations in the Optimization Results tab. The candidate which achieved highest profit is the one with 20 pips distance from current price to MA. We double-click it and its settings are automatically fed into the Tester for further analyses.

✓ You choose the period for backtesting and the precision method;
✓ You pick the timeframe of the Moving Average;
✓ You select the period of the Moving Average;
✓ You decide the distance to the Moving Average;
✓ You choose the timeframe and period of the take-profit Moving Average;
✓ You set the direction of the trades - long, short or both;
✓ You decide whether to trade one or multiple situations;
✓ You can open one or more than one trades for every situation;
✓ You decide the volume of the trade;
✓ You select the optimization settings.
