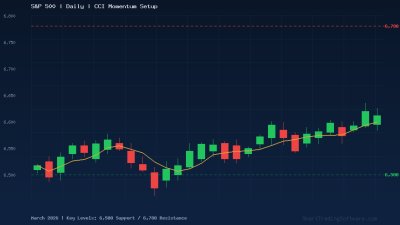
S&P 500 Recovers to 6,590 — What the CCI Says About the Next Move
The S&P 500 closed at 6,591.90 on March 25, 2026, marking a 0.54% gain from the prior session at 6,556.37. After weeks of choppy consolidation between 6,500 and 6,800, the index appears to be building a base for its next directional move. The Commodity Channel Index (CCI) on the daily timeframe is currently crossing back above the −100 level, a classic signal that selling momentum is fading and a potential mean-reversion bounce may be underway.
The broader context remains constructive but cautious. JPMorgan recently revised its 2026 year-end target down to 7,200 from 7,500, while Goldman Sachs maintains a more optimistic 7,600 target. For short- to medium-term traders, the real opportunity lies in trading the range between the 6,500 support floor and the 6,731–6,782 resistance zone overhead.
How to Trade the S&P 500 Recovery Using CCI Momentum
The CCI indicator measures how far the current price has deviated from its statistical average. When CCI drops below −100 and then crosses back above it, the market is signaling that the oversold condition is resolving. Combined with the S&P 500 holding firmly above the 6,500 level, this creates a high-probability long setup.
Entry Conditions
Wait for the CCI(20) on the daily chart to cross above −100 from below. Confirm the signal with the price closing above the 20-period simple moving average, which currently sits near 6,540. A break above 6,600 on volume would add further confirmation. Enter long on the next candle open after both conditions are met.
Stop Loss and Take Profit Levels
Place the stop loss below the recent swing low at 6,480, giving the trade approximately 110 points of risk from a 6,590 entry. The first take-profit target should be the lower boundary of the resistance zone at 6,731, offering roughly 141 points of reward and a 1.28:1 risk-reward ratio. A more aggressive second target would be 6,782 — the upper resistance boundary — yielding a 1.74:1 ratio. Consider scaling out: close 60% at the first target and trail the remainder with a 50-point trailing stop.
Managing the Trade in a Choppy Market
Given the current consolidation environment, false breakouts are common. If the CCI crosses back below −100 within two days of entry, it may be prudent to exit early rather than waiting for the stop loss to be hit. Similarly, if the index stalls near 6,650 for more than three sessions without progressing, tightening the stop to breakeven protects capital while allowing room for a delayed move.
Why Automation Gives You an Edge in Range-Bound Markets
Range-bound conditions demand discipline that manual trading often struggles to deliver. When the S&P 500 oscillates between clearly defined levels, automated systems excel because they execute entries and exits precisely at predetermined CCI thresholds — without hesitation and without the temptation to deviate from the plan.
The CCI Bot from SmartTradingSoftware is purpose-built for this type of setup. It monitors CCI crossovers across multiple instruments and timeframes, placing trades the instant conditions are satisfied. For the current S&P 500 range, you can configure it to trigger long entries on CCI(20) crosses above −100 and short entries on crosses below +100, effectively capturing both sides of the consolidation.
If you prefer a trend-following approach for when the index eventually breaks out of this range, the Trend Lines Bot uses moving average crossovers and dynamic trendline detection to catch the beginning of the next sustained move. Pairing it with the CCI Bot covers both the current range-trading regime and the eventual breakout.
Key S&P 500 Levels to Watch This Week
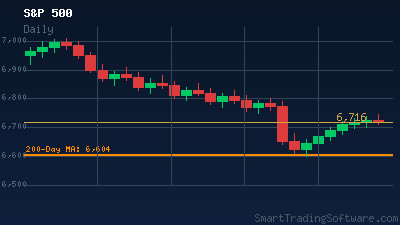
The following support and resistance levels are critical for any S&P 500 trading strategy in the near term. Support sits at 6,556 (the March 24 close and recent pivot), followed by the psychological and technical floor at 6,500. A break below 6,500 would open the door to 6,304, the next major support zone. On the upside, the first hurdle is 6,600, followed by the heavier resistance cluster between 6,731 and 6,782. A daily close above 6,782 would be a significant technical achievement, potentially triggering momentum-driven buying toward 7,000.
Traders should also note that elevated volatility is expected in Q2 and Q3 of 2026, meaning that breakout trades from this consolidation range could see accelerated follow-through once a clear direction is established.
Getting Started with Automated S&P 500 Trading
1. Backtest first. Use the Indicators Tester to verify how a CCI-based strategy performs on S&P 500 historical data. Test multiple parameter combinations — CCI period lengths of 14, 20, and 34 — to find the optimal setting for the current market regime.
2. Configure your bot. Set up the CCI Bot with your chosen parameters: CCI period, entry threshold (−100 for longs, +100 for shorts), stop loss at 110 points, and tiered take-profit levels at 6,731 and 6,782.
3. Start on demo. Run the bot on a MetaTrader 4 or 5 demo account for at least one week to verify that execution matches your backtested expectations in live market conditions.
4. Scale into live trading. Once satisfied with demo results, deploy on a live account with conservative position sizing. Begin with 1% risk per trade and adjust as you build confidence in the strategy's performance.
Have questions about configuring the CCI Bot for S&P 500 trading or need help choosing the right combination of tools for your strategy? Get in touch with our team — we are happy to help you find the best setup for your trading goals.