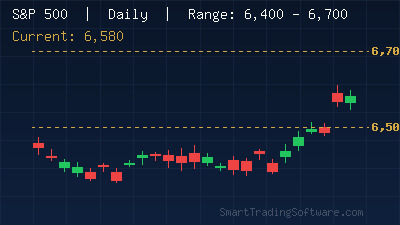
S&P 500 Consolidates Near 6,580 — A Range-Bound Opportunity
The S&P 500 has settled into a well-defined consolidation zone between 6,400 and 6,700 as April 2026 progresses, with the index currently hovering around 6,580. After the strong rally that characterized the first quarter, the market has entered a phase of indecision — momentum indicators are neutral, and traders are waiting for a clear catalyst to establish the next directional move. This type of range-bound environment, while frustrating for trend followers, presents distinct opportunities for disciplined traders who know how to work within defined boundaries.
The 50-period simple moving average sits just above 6,500, reinforcing this area as a significant support floor. On the upside, the 50-day moving average near 6,784 acts as the primary resistance barrier. Until the index decisively closes above that level, the broader picture remains one of consolidation rather than continuation. Macro headwinds — including geopolitical uncertainty and mixed earnings expectations — are keeping buyers cautious while the technical floor around 6,400 continues to attract dip buyers.
Trading the Range: A Structured Approach to the 6,400–6,700 Zone
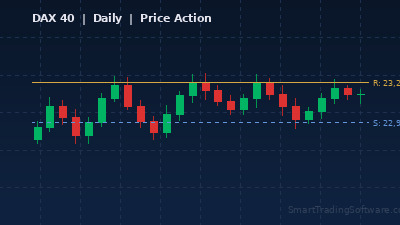
Range-bound markets reward patience and precision. Rather than chasing breakouts that may fail, the strategy here centers on identifying high-probability entries near the edges of the established range and managing risk tightly with clearly defined levels.
Long Setup Near Support
When the S&P 500 pulls back toward the 6,400–6,500 support zone, look for confirmation signals before entering long positions. A bullish candlestick pattern — such as a hammer or engulfing candle — on the daily timeframe near 6,450 provides a solid entry trigger. Set the stop loss 40–50 points below the entry, around 6,380, and target the mid-range area near 6,600 for the first take profit. Aggressive traders can hold a partial position for a test of the 6,700 resistance ceiling.
Short Setup Near Resistance
Conversely, when price approaches the 6,680–6,700 zone without strong momentum, bearish rejection patterns offer short opportunities. A failed breakout above 6,700 — characterized by a wick above the level followed by a close below it — signals that sellers are still defending the upper boundary. Stops should sit 40 points above the rejection candle, with the initial target around 6,550 and a secondary target near the 6,450 support area.
Risk Management Parameters
Position sizing is especially important in range markets because the profit window per trade is smaller than in trending conditions. A risk-to-reward ratio of at least 1:1.5 keeps the strategy viable over a series of trades. Use the MA Distance Indicator to gauge how far price has stretched from key moving averages — when the distance is extreme near range boundaries, the probability of a mean reversion move increases.
Why Automation Gives Range Traders an Edge
The challenge with range trading is consistency. It requires monitoring price action at specific levels across multiple sessions and executing entries without hesitation when conditions align. Human traders often second-guess entries after a string of failed breakouts, or they miss setups entirely because they are not watching the chart at the right moment.
Automated trading bots eliminate these issues. The Price Action Bot is specifically designed to identify candlestick patterns at predefined support and resistance levels and execute trades with consistent parameters. It does not experience fatigue, emotional bias, or the temptation to chase a late move — it simply executes the plan every time the conditions are met.
For traders who want to validate their range strategy before deploying capital, the Indicators Tester allows you to backtest entry and exit rules against historical S&P 500 data. This is particularly valuable in the current environment, where confirming that your parameters perform well during previous consolidation phases can make the difference between confidence and doubt when real money is on the line.
Key Levels to Watch This Week
The critical price zones for the S&P 500 heading into mid-April 2026 are tightly clustered, which means the resolution — when it comes — could be swift. Here are the numbers to keep on your radar:
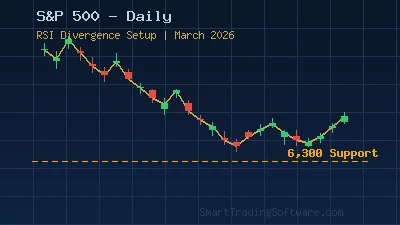
Primary support: 6,500 — the 50-period SMA that has held on multiple retests. A daily close below this level shifts the short-term bias to bearish and opens the door to a move toward 6,400.
Range floor: 6,400 — the lower boundary of the consolidation zone. A breakdown below 6,400 would signal a more significant correction, potentially targeting the 6,200 area where longer-term moving averages converge.
Range ceiling: 6,700 — the level that has capped rallies throughout the first half of April. A daily close above this zone would be the first sign that bulls are regaining control.
Breakout confirmation: 6,784 — the 50-day moving average and the level that multiple analysts cite as the threshold for a return to the broader uptrend. A sustained move above 6,784 shifts the outlook from neutral to bullish, with the next target near 7,000.
Getting Started with Automated Range Trading
If the current S&P 500 consolidation matches your trading style, here is how to put a structured plan into action:
1. Define your range boundaries on the daily chart — use 6,400 as support and 6,700 as resistance based on current price action.
2. Backtest your entry and exit rules using the Indicators Tester to verify that your parameters produce positive results across similar historical consolidation periods.
3. Configure the Price Action Bot with your validated parameters — set the support and resistance zones, candlestick pattern triggers, stop loss distances, and take profit targets.
4. Monitor the bot's performance during the first few trades to ensure execution matches your expectations, then let the automation handle the repetitive work of watching and waiting.
5. Track how far price deviates from the mean with the MA Distance Indicator to refine your entries and exits as the range evolves.
Range markets do not last forever. When the S&P 500 eventually breaks out of the 6,400–6,700 zone — whether to the upside or downside — the move is likely to be sharp. Having an automated system in place ensures you are positioned to capture the breakout without needing to stare at the screen around the clock.
Have questions about configuring your bots for the current market environment? Reach out to our team — we are here to help you set up the right strategy for the conditions at hand.