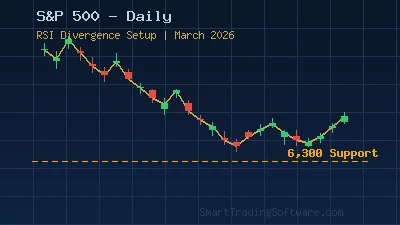
S&P 500 Drops to 6,370: Five-Week Selloff Creates RSI Divergence Setup
The S&P 500 index closed at 6,368.85 on March 27, marking its fifth consecutive weekly decline and hitting a seven-month low. Rising geopolitical tensions in the Strait of Hormuz pushed Brent crude above $110, amplifying investor anxiety and accelerating the broad market selloff. The index has shed over 8% from its January highs near 6,900, and bearish sentiment dominates with prediction markets pricing a 63% probability of further downside on the next session.
Yet extended selloffs of this magnitude frequently produce tradeable bounces, especially when momentum indicators begin to diverge from price. Traders who can identify these divergence signals early stand to capture sharp reversals before the crowd reacts. The current technical setup on the S&P 500 daily chart is presenting exactly this kind of opportunity.
Spotting RSI Divergence on the S&P 500 Daily Chart
While the S&P 500 has printed lower lows over the past three weeks — dropping from 6,590 to 6,370 — the 14-period Relative Strength Index has begun forming higher lows. This classic bullish RSI divergence pattern suggests that selling momentum is weakening even as price continues to drift lower. The RSI currently reads near 32, hovering just above the oversold threshold of 30, which adds further weight to the reversal thesis.
Entry Parameters for the Divergence Trade
A confirmed entry requires price to close above the most recent swing high at 6,450 on the daily timeframe. This level coincides with the broken support zone from mid-March and would signal that buyers are stepping back into the market with conviction. Volume confirmation — a session with above-average volume on the breakout candle — strengthens the setup considerably.
Stop Loss and Take Profit Levels
Place the stop loss below the current swing low at 6,300, which represents the 38.2% Fibonacci retracement of the 2025 rally and a zone where institutional buyers previously defended price. This gives roughly 70 points of risk from the entry at 6,450. For the first take profit target, aim for 6,590, the level where the most recent breakdown occurred, offering a reward of 140 points and a 2:1 risk-to-reward ratio. A second target at 6,690 — the 50-day moving average zone — provides an extended opportunity for traders willing to hold through consolidation.
Why Automated RSI Divergence Detection Matters
RSI divergence signals can form over multiple sessions and across several timeframes simultaneously, making manual scanning of indices, futures, and correlated instruments an exhausting task. An automated approach eliminates the risk of missing a divergence setup that develops overnight or during pre-market hours when most retail traders are not actively watching their screens.
The RSI Divergence Bot is designed specifically for this purpose. It continuously monitors RSI behavior across customizable periods and automatically executes trades when divergence conditions align with your predefined entry rules. For the current S&P 500 setup, the bot can be configured with a 14-period RSI, daily timeframe, and the specific price and indicator thresholds described above — then left to manage the trade from entry through both take profit levels.
Traders who prefer to validate the strategy before committing capital can use the Indicators Tester to backtest RSI divergence performance on historical S&P 500 data. This tool lets you measure win rate, average return, and maximum drawdown across different market conditions — giving you confidence in the approach before deploying it live.
Key Levels to Watch This Week
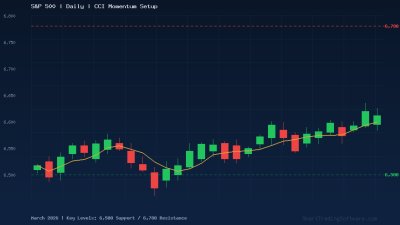
The immediate support zone sits at 6,300, where the 38.2% Fibonacci level and a cluster of prior swing lows converge. A break below this level would invalidate the bullish divergence thesis and open the path toward 5,940, a deeper Fibonacci extension that aligns with the August 2025 consolidation zone. On the upside, resistance emerges at 6,450, followed by 6,590 and the more significant 6,690 zone where the declining 50-day moving average currently resides. A daily close above 6,690 would shift the intermediate trend back to neutral and potentially attract momentum buyers back into the market.
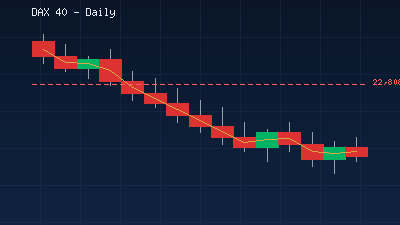
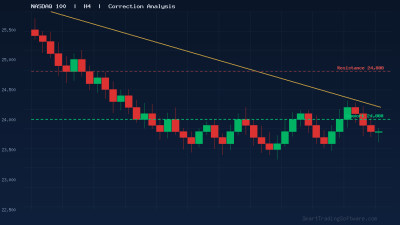
Traders looking to capture moves across multiple correlated instruments can also apply the Trend Lines Bot to track moving average crossovers on related indices like the NASDAQ 100 and Russell 2000, which often lead or confirm S&P 500 reversals.
Getting Started with the RSI Divergence Strategy
1. Open a daily chart of the S&P 500 (US500) on MetaTrader 5 and apply the 14-period RSI indicator.
2. Identify the current bullish divergence by comparing the price lows from March 14 and March 27 against the corresponding RSI lows.
3. Set a buy stop order at 6,450 with a stop loss at 6,300 and take profit at 6,590.
4. Install the RSI Divergence Bot to automate detection and execution of similar setups across all your monitored instruments.
5. Use the Indicators Tester to backtest the strategy across at least 12 months of S&P 500 historical data to calibrate your risk parameters.
For personalized assistance configuring the RSI Divergence Bot for index trading, reach out to our team through the contact page — we are happy to help you fine-tune the settings for your specific trading style and risk tolerance.