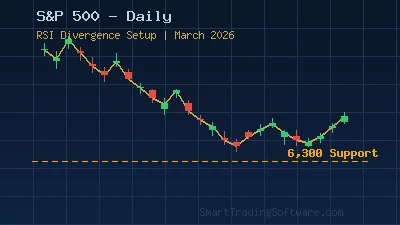
The S&P 500 (SPX) is trading at a critical inflection point as of March 20, 2026. With the index sitting at 6,716 — just above its key 200-day simple moving average at 6,604 — traders are watching closely to determine whether this is a temporary pullback within a long-term bull market or the beginning of a more sustained correction. Short-term moving averages (8-day, 20-day, and 50-day SMAs) are all above price, generating sell signals, while the 200-day SMA still points higher — a classic battle between short-term bearish pressure and long-term bullish structure.
S&P 500 Current Market Context: Bearish Pressure Meets Long-Term Support
After reaching highs near the 7,000 resistance zone in early 2026, the S&P 500 has pulled back over 4% from its recent highs. The index declined roughly 3.42% over the past month and has twice bounced from the 200-day moving average — a level that now serves as the most critical support in the market.
Market volatility has picked up, with the VIX hovering around 24, reflecting elevated uncertainty. This environment creates both risk and opportunity for disciplined traders who can identify high-probability setups using technical indicators like the Commodity Channel Index (CCI) and RSI divergence.
Key technical picture as of March 20, 2026:
- Current Price: ~6,716 (SPX)
- 200-Day SMA: 6,604 (major support)
- 50-Day SMA: ~6,850 (now resistance)
- Key Resistance: 7,000 psychological level
- Key Support: 6,607 / 6,604 (200-day MA cluster)
- RSI trend: Falling — early bearish warning signal
- VIX: ~24 — elevated volatility
The pattern shows the index coiling between 6,680 and 6,780 in the near term, with market cycle analysis pointing to a choppy push higher into late March before potential additional volatility in Q2 2026. Goldman Sachs maintains a 7,600 year-end target, but near-term technicals call for caution.
The Strategy: Trading S&P 500 With CCI and RSI Divergence
When price is hovering at a major moving average like the 200-day SMA, two indicators stand out as particularly powerful: the Commodity Channel Index (CCI) and RSI divergence. Together, they help identify when a short-term correction is likely to reverse, or when momentum confirms a deeper breakdown — enabling traders to enter with confidence rather than guessing at direction.
The core strategy works as follows: when the S&P 500 approaches the 200-day MA from above, a bearish CCI reading below -100 combined with a bearish RSI divergence (price makes equal or lower lows while RSI makes higher lows) signals that downward momentum is losing steam. This combination often marks the turning point where short-sellers cover and buyers step in at value.
Conversely, if price breaks below the 200-day MA with CCI confirming below -100 and no RSI bullish divergence present, the probability of continuation increases significantly, and traders should avoid premature long entries until a new support level establishes.
Entry Parameters
Long scenario (bounce play): Enter a long position when SPX (or an S&P 500 CFD/futures contract) tests the 6,604–6,630 zone, CCI crosses back above -100 from oversold territory, and RSI shows bullish divergence on the H4 or daily timeframe. Confirmation candle close above 6,650 strengthens the signal.
Short scenario (breakdown play): Enter short if SPX breaks and closes below 6,580 on the daily chart, CCI remains below -100, and the RSI continues its falling trend without divergence. The breakdown target in this case is 6,304 — the next major support level.
Stop Loss and Take Profit
Long trade SL: Place stop loss at 6,560 — below the 200-day MA cluster and recent swing lows. This limits risk to approximately 0.8–1% of index value.
Long trade TP1: 6,850 (50-day SMA, first resistance). TPR: 7,000 (psychological resistance).
Short trade SL: 6,660 (above the breakdown candle body).
Short trade TP1: 6,450. TP2: 6,304.
Timeframes
This setup works best on the H4 (4-hour) and Daily timeframes. The daily chart provides the primary trend context and key levels, while H4 gives tighter entry timing. Avoid trading purely on M15 or M30 during volatile VIX environments above 20.
Why Automation Improves Your S&P 500 Trading Results
Manual index trading at key levels like the 200-day MA is psychologically demanding. The market can oscillate 0.5–1% around this zone for days before confirming a direction — and the temptation to exit prematurely or add to a losing position is high. This is where automated trading bots and technical indicators shine.
The CCI Bot (€250) is specifically designed to trade CCI-based strategies on MetaTrader 4/5. It monitors CCI readings in real time, executes entries when the indicator crosses defined thresholds, and manages exits automatically — eliminating emotional decision-making around major support levels.
For traders who prefer RSI-based setups, the RSI Divergence Bot (€421) automatically detects and trades bullish and bearish divergence patterns across any instrument, including US index CFDs. It scans multiple timeframes simultaneously, something impossible to do manually in real time.
To gauge how far the S&P 500 is trading from its key moving averages — a crucial context metric for this strategy — the MA Distance Indicator (€25) plots the percentage deviation from any selected moving average directly on your chart. When the S&P 500 moves more than 2–3% below its 200-day MA, this indicator highlights extreme readings that historically precede sharp mean-reversion bounces.
Together, these tools remove guesswork and enforce discipline — two traits that separate consistently profitable index traders from the majority.
Key S&P 500 Levels to Watch in March–April 2026
Knowing your levels before the market opens is the foundation of structured trading. Here are the most important price zones for the S&P 500 over the coming weeks:
Critical Support Zones:
- 6,607 – 6,604: 200-day SMA cluster — the must-hold level for the bull case. Two prior bounces occurred here.
- 6,304: Next major support if the 200-day MA breaks — coincides with prior consolidation from late 2025.
- 5,944: Deep support, representing a ~11% drawdown from current levels — relevant only in an accelerated bear scenario.
Critical Resistance Zones:
- 6,780 – 6,850: 50-day SMA and near-term distribution zone. Multiple failed rally attempts here.
- 7,000 – 7,007: Major psychological resistance. Bulls need a clean break above 7,000 to invalidate the near-term bearish structure.
- 7,273: Next target if 7,000 is cleared, based on Fibonacci extension levels.
The near-term bias is neutral-to-bearish as long as the index trades below the 50-day SMA (~6,850). A recovery above 6,850 would shift the momentum back to bullish and open the door toward 7,000.
Getting Started: Trade the S&P 500 With Automated Precision
Whether you are trading US index CFDs on MetaTrader 4 or MetaTrader 5, implementing a structured, indicator-driven approach is the fastest way to improve consistency. Here are the steps to get started:
- Install the MA Distance Indicator on your S&P 500 chart to immediately visualize how far price is from its 200-day moving average. This single metric provides context for every trade you take.
- Add the CCI Indicator to your H4 and Daily charts and mark the -100 and +100 thresholds. These are your trigger zones for the strategy described above.
- Deploy the CCI Bot or RSI Divergence Bot to automate your entries and exits. Both bots run on MetaTrader 4 and 5 and can be configured for index instruments including S&P 500 CFDs and US30.
- Backtest your parameters using the Indicators Tester to validate how the CCI and RSI divergence signals performed on the S&P 500 historically before risking real capital.
- Set your risk parameters: With VIX at 24, consider reducing your standard position size by 20–30% to account for wider intraday swings.
The S&P 500's current technical setup at the 200-day moving average represents one of the clearest risk/reward opportunities of Q1 2026 — but only for traders with a defined, rules-based approach. Ready to trade smarter? Contact our team to get a personalized recommendation on which tools best fit your trading style and risk tolerance.