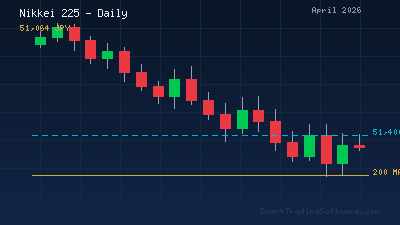
Nikkei 225 Slides to 51,000: Four-Session Losing Streak Opens Trend Line Entry
The Nikkei 225 tumbled to 51,064 on April 1, extending its losing streak to four consecutive sessions as oil price escalations in the Middle East rattled global equity markets. The Japanese benchmark shed over 13% in March alone, posting its worst monthly performance since the 2008 financial crisis. From the January 2026 peak above 58,000, the index has now retreated roughly 12%, dragging it back toward the 200-day moving average sitting at 50,234.
Sharp drawdowns of this scale tend to exhaust selling pressure faster than many traders anticipate. When the 200-day moving average is tested after a prolonged decline, it frequently acts as a springboard for mean-reversion rallies. The daily chart on the Nikkei 225 currently shows price compressing against this critical moving average, and the 50-day MA at 50,066 is providing a secondary support layer just beneath. This kind of dual moving average confluence often precedes a directional breakout that trend-following systems are built to capture.
Trading the Recovery: A Moving Average Trend Lines Approach
The most effective strategy for capturing a Nikkei 225 recovery from current levels involves combining moving average direction with price-based trend line confirmation. Rather than guessing the exact bottom, this approach waits for the 5-day moving average to cross back above the 50-day MA while price simultaneously breaks above a descending trend line drawn from the February highs.
Entry Setup and Parameters
A long entry triggers when the daily candle closes above 51,400, which coincides with the descending trend line resistance and the reclaimed 5-day MA. The entry confirmation requires the 50-day MA to remain below the closing price, filtering out premature signals during whipsaw moves. Conservative traders may wait for a second daily close above this level before committing capital.
Stop Loss and Take Profit Levels
Place the initial stop loss at 49,800, which sits 150 points below the 200-day MA at 50,234. This gives enough breathing room for volatility without risking excessive drawdown. First take profit at 52,800 captures the move back toward the March consolidation zone. A second target at 54,300 aligns with the next structural resistance where the index stalled in mid-March. Traders running a 1:2 risk-reward setup can trail the stop to breakeven once the first target is hit.
Why Automation Matters in a Volatile Nikkei Market
The Nikkei 225 trades during the Asian session, which means European and American traders are often asleep when the best setups trigger. Manual execution in this market almost guarantees missed entries and late exits. Automated systems solve this problem by monitoring price against moving averages and trend lines around the clock, executing trades the moment conditions align.
The Trend Lines Bot is specifically engineered for this type of moving average crossover and trend line breakout strategy. It identifies dynamic support and resistance using multiple moving average periods and enters trades automatically when price confirms the trend direction. For indices like the Nikkei 225 where overnight gaps are common, having an automated system managing your positions removes the emotional component and ensures consistent execution.
Traders who prefer a price action approach can also use the Price Action Bot, which analyzes candlestick patterns around key support and resistance zones. This bot works well in conjunction with trend-following entries, providing additional confirmation signals before committing to a trade.
Key Levels to Watch This Week
The immediate support zone sits between 50,000 and 50,234, defined by the 200-day moving average and the round psychological number. A daily close below 49,800 would invalidate the recovery thesis and suggest deeper downside toward 48,500. On the upside, 51,400 acts as the first resistance hurdle where the descending trend line meets recent consolidation. Clearing 52,800 would confirm bullish momentum and open the path toward 54,300.
Keep an eye on the USD/JPY pair as well. The yen has strengthened significantly during this equity selloff, and any reversal in yen strength typically coincides with Nikkei buying interest. BOJ policy meetings remain the wildcard, as any shift in tone regarding rate normalization could accelerate moves in either direction.
Before committing real capital, consider backtesting your trend line strategy on historical Nikkei data. The Indicators Tester allows you to simulate moving average crossover and trend line strategies against years of index data, giving you confidence in your parameters before going live.
Getting Started with Nikkei 225 Trend Trading
1. Open the Nikkei 225 daily chart on your MetaTrader platform and add the 5-day, 50-day, and 200-day moving averages.
2. Draw a descending trend line connecting the February and March highs to identify the current resistance slope.
3. Use the Indicators Tester to backtest the MA crossover strategy with your chosen parameters on historical data.
4. Install the Trend Lines Bot on your MetaTrader 4 or 5 platform and configure it for the Nikkei 225 instrument.
5. Set the entry, stop loss, and take profit levels according to the parameters outlined above, and let the bot monitor for the trend line breakout.
If you need help configuring the bot for Nikkei 225 trading or have questions about parameter optimization, contact our support team for personalized guidance.