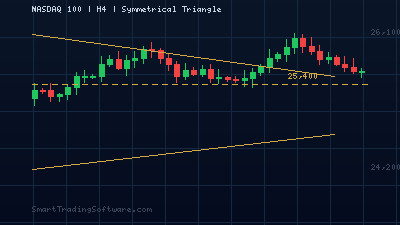
The NASDAQ 100 index is trading near 25,055 as of mid-April 2026, sitting right in the middle of a well-defined symmetrical triangle pattern that has been compressing price action since late February. With the upper boundary near 26,200 and the lower trendline resting around 24,000, a decisive breakout is looking increasingly likely in the coming sessions. The CCI (Commodity Channel Index) is flashing early divergence signals that could help traders position ahead of the move.
This consolidation follows a volatile first quarter shaped by geopolitical uncertainty, inflation concerns, and rotating sector leadership within the tech-heavy index. Volume has been tapering during the squeeze, a classic precondition for an explosive directional move. Traders who can identify the breakout direction early stand to capture a significant swing.
Using CCI Divergence to Anticipate the NASDAQ Breakout
The Commodity Channel Index is a momentum oscillator that measures the deviation of price from its statistical mean. When the NASDAQ 100 prints higher lows on the chart while the CCI prints lower lows, a bearish divergence forms, warning that upside momentum is fading. Conversely, when price makes lower lows but the CCI makes higher lows, a bullish divergence signals accumulating buying pressure beneath the surface.
On the 4-hour chart, the NASDAQ 100 recently tested the 24,100 support zone while the CCI formed a higher low compared to its previous reading at that level. This bullish divergence suggests that sellers are losing conviction near the triangle\'s lower boundary, and a breakout above the 25,400 mid-range resistance could accelerate toward the upper trendline at 26,200.
Entry Parameters for the Bullish Breakout
The primary entry trigger is a 4-hour candle close above 25,400 accompanied by CCI crossing above the +100 level, confirming strong upward momentum. A secondary confirmation comes from volume expanding beyond the 20-period average at the breakout candle. The initial target sits at 26,200, with an extended objective near 26,800 if the triangle breakout carries the measured move. Place the stop loss below the most recent swing low at 24,700, giving the trade room to breathe while maintaining a favorable risk-to-reward ratio of approximately 1:2.5.
Bearish Scenario Setup
If the index fails to hold 24,000, a breakdown below the triangle support would target 23,200 as the first measured objective. In this case, wait for a 4-hour close below 24,000 with CCI dropping below -100 to confirm the bearish momentum. The stop loss for short positions should be placed above 24,500.
Why Automated Execution Matters for Triangle Breakouts
Triangle breakouts are notoriously difficult to trade manually. The breakout candle often moves quickly, and hesitation can mean entering at a significantly worse price or missing the move entirely. False breakouts add another layer of complexity, as the index can temporarily pierce a boundary before reversing sharply.
Automated trading systems solve both problems by monitoring the chart continuously and executing the moment all conditions are met. The CCI Bot is specifically designed to trade CCI-based signals, including divergence setups and overbought/oversold reversals. It can be configured to require a CCI threshold crossing plus a price breakout confirmation before entering, filtering out many of the false signals that trap manual traders.
For traders who prefer to combine CCI with trend-following logic, the Trend Lines Bot can overlay moving average filters on the breakout setup. This dual approach ensures you only take trades in the direction of the prevailing trend, which is especially valuable in the current environment where the NASDAQ\'s long-term uptrend remains technically intact despite the consolidation.
Key Levels to Watch This Week
The immediate support zone sits between 24,000 and 24,100, where the lower triangle boundary meets a horizontal support level tested multiple times since March. A break below this area would likely trigger stop-loss clusters and accelerate selling toward the 23,200 region, which aligns with the 200-day moving average.
On the upside, the first resistance level is 25,400, followed by the triangle\'s upper boundary near 26,200. A sustained move above 26,200 would represent a clean breakout with measured move potential toward 28,000 over the following weeks. The 50-day moving average currently sits near 25,300, making the 25,300-25,400 zone a critical area to watch for breakout confirmation.
Before committing capital to any breakout strategy, backtesting the setup against historical data is essential. The Indicators Tester allows you to run the CCI divergence strategy against past NASDAQ price data to evaluate win rate, average profit, and maximum drawdown before going live.
Getting Started with Automated NASDAQ Trading
Setting up an automated CCI breakout strategy takes just a few steps:
1. Download the CCI Bot and install it on your MetaTrader 4 or 5 platform. 2. Set the instrument to NASDAQ 100 (US100 or NAS100, depending on your broker\'s symbol). 3. Configure the CCI period to 20 and set the overbought/oversold thresholds to +100 and -100. 4. Define your risk parameters, including lot size, stop loss at 24,700, and take profit at 26,200 for the bullish scenario. 5. Enable the divergence detection module and set the lookback period to 10 bars on the H4 timeframe. 6. Activate the bot and let it monitor the symmetrical triangle boundaries around the clock.
The combination of CCI divergence signals with the triangle pattern creates a high-probability setup that has historically performed well during periods of compressed volatility. Whether the NASDAQ breaks higher toward new all-time highs or pulls back to test deeper support, having an automated system in place ensures you are positioned to react instantly when the move begins.
Have questions about configuring the CCI Bot for index trading? Reach out through our contact page and our team will help you optimize the settings for your trading style and risk tolerance.