NASDAQ 100 Slides Into Correction Territory Below 24,000
The NASDAQ 100 has entered official correction territory in late March 2026, slicing through the critical 24,000 support level and breaking below its 200-day moving average for the first time in ten months. On March 26, the NASDAQ Composite closed at 21,408 — down 2.38% in a single session and over 10% from its all-time closing high. Geopolitical uncertainty surrounding Middle East tensions combined with renewed tariff pressures have fueled aggressive selling across the technology sector, pushing prices into a demand zone between 23,600 and 23,800 on the NASDAQ 100.
For traders watching this decline, the question is not whether a bounce will come, but where precisely the market finds a floor and how to capitalize on the recovery. The current price structure offers well-defined support and resistance levels that lend themselves to systematic, rules-based strategies — exactly the kind of setup where automated trend-following tools can provide a decisive edge.
Trading the NASDAQ 100 Correction with Trend Line Strategy
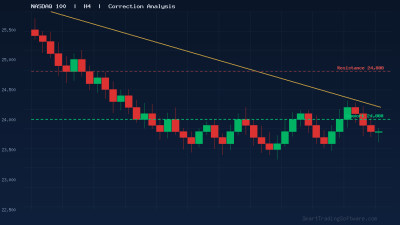
The broader corrective structure on the H4 and daily charts remains under bearish pressure, with the index trading below its key higher-timeframe moving averages. However, on shorter timeframes such as the M15 and H1 charts, price has started forming higher lows near the 23,600–23,800 support zone, hinting that a corrective bounce may be underway. This divergence between timeframes creates a compelling setup for traders using trend line breakout strategies.
Entry Parameters for the Bounce Play
The primary entry trigger involves monitoring a descending trend line drawn from the late February swing high near 25,800 through the March 20 lower high at approximately 24,600. A confirmed close above this trend line on the H1 chart, combined with a push above the 24,200–24,400 resistance band, would signal that short-term buyers are gaining control. Conservative traders may wait for a retest of the broken trend line as new support before entering long positions.
Stop-Loss and Risk Management
A logical stop-loss sits below the recent swing low in the 23,200 zone, which represents the extended downside objective if sellers maintain pressure. This placement keeps risk defined while allowing room for intraday volatility. Position sizing should account for the elevated VIX environment, where wider-than-normal swings can trigger premature stop-outs if stops are placed too tightly.
Take-Profit Targets
The first profit target aligns with the 200-day moving average zone near 24,100–24,500, which must be reclaimed to restore any bullish sentiment. A more ambitious second target lies at 24,600–24,800, corresponding to the H4 supply zone where previous selling originated. Traders looking to capture a larger move should keep a portion of their position open targeting the 25,000–25,100 structural resistance, though this would require a meaningful shift in broader market sentiment.
Why Automated Execution Makes a Difference in Volatile Markets
Correction-phase trading demands precision and emotional discipline that manual execution often struggles to deliver. When the NASDAQ 100 swings 500 points intraday — as it has several times this month — hesitation on entries or delayed stop management can turn a well-planned trade into a losing one. Automated trading tools remove this psychological burden entirely.
The Trend Lines Bot is specifically designed for this type of setup. It automatically identifies and draws trend lines across multiple timeframes, then executes trades when price confirms a breakout or bounce from those lines. In the current NASDAQ environment, the bot can monitor the descending trend line from the February highs and trigger entries the moment price breaks above it with sufficient momentum — without requiring you to watch charts around the clock.
For traders who prefer to confirm trend line breaks with momentum indicators, the RSI Divergence Bot adds another layer of confluence. RSI divergence often appears at correction bottoms, where price makes a lower low but RSI makes a higher low, signaling that selling pressure is fading. Combining this signal with a trend line break creates a higher-probability entry that the bot can execute automatically across multiple instruments simultaneously.
Key NASDAQ 100 Levels to Watch This Week
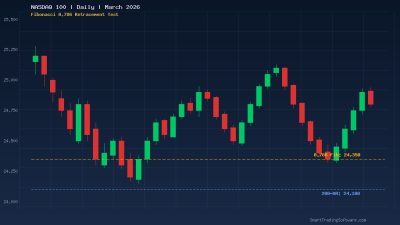
The support and resistance framework for the NASDAQ 100 is clearly defined heading into late March. On the downside, the 23,600–23,800 demand zone represents the first line of defense. A break below this area opens the door to 23,200, and below that, the 38.2% Fibonacci retracement of the entire 2025 rally sits near 22,500 — a level that would represent a deeper correction but also a historically significant buying opportunity.
On the upside, the immediate challenge is the 24,200–24,400 band where recent recovery attempts have stalled. Above that, the 200-day moving average near 24,500 acts as a dynamic ceiling. Clearing both would shift attention to 24,800 and eventually 25,000–25,100, where sellers are likely to reappear in force. For the broader trend to resume its upward trajectory, the index would need to convincingly reclaim the 26,000 area — the vicinity of its all-time highs.
Monitoring how price reacts at these levels is where the MA Distance Indicator proves especially useful. It measures the gap between current price and key moving averages, helping you gauge when the NASDAQ has become overstretched to the downside and a mean reversion bounce becomes statistically more likely.
Getting Started with Automated NASDAQ Trading
Setting up an automated approach to trade this NASDAQ correction involves a few straightforward steps:
1. Open a MetaTrader 5 account with a broker that offers NASDAQ 100 CFDs (commonly listed as NAS100 or USTEC).
2. Install the Trend Lines Bot on your MT5 platform and configure it for the H1 or H4 timeframe on the NASDAQ chart.
3. Set the bot's parameters to match the current market structure: entry on trend line break above the descending resistance, stop-loss below 23,200, and take-profit targets at 24,400 and 24,800.
4. Enable the RSI Divergence Bot alongside for added confluence on entries where bullish RSI divergence confirms the trend line signal.
5. Monitor the bot's performance through MT5's built-in reporting and adjust lot sizing as the correction evolves.
Market corrections create some of the best trading opportunities for those prepared to act decisively. If you have questions about configuring these tools for the current NASDAQ environment or need guidance on optimal settings, feel free to reach out through our contact page — our team is ready to help you get started.