DAX 40 Drops to 22,380: Why the Oversold Bounce Could Be a High-Probability Trade
The German DAX 40 index has taken a significant hit in March 2026, sliding from its January all-time high of 25,507 down to 22,380 as of March 20 — a correction of over 12%. The sell-off has been driven by escalating Middle East tensions, renewed energy price concerns, and a broader risk-off shift across European equities. For traders who follow technical setups, this kind of deep pullback into oversold territory often presents one of the best risk-reward opportunities of the quarter.
With the 14-day RSI sitting near 31.8 — firmly in oversold territory — and the index approaching its 200-day moving average around 23,488, the stage is set for either a meaningful bounce or a breakdown that accelerates toward 22,000. Understanding how to position for both scenarios is exactly where a structured, automated approach becomes valuable.
Reading the Technical Setup on the DAX Daily Chart
The current DAX structure tells a clear story. After peaking at 25,507 in mid-January, the index entered a distribution phase between 24,500 and 25,000 before breaking down sharply in early March. The 50-day moving average at approximately 24,900 and the 100-day MA near 24,732 are now acting as overhead resistance — well above the current price.
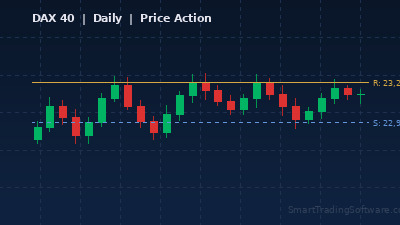
The key zone to watch sits between 22,000 and 23,000. This area served as the accumulation base during the October-November 2025 rally, and a return to this zone with an oversold RSI creates a potential mean-reversion setup. The 200-day moving average near 23,488 is the first recovery target, while a failure to hold 22,000 would open the door to a deeper correction toward 21,500.
Entry Parameters for the Bounce Setup
A disciplined approach to this trade involves waiting for confirmation rather than catching the falling knife. Look for a daily candle close above 22,600 with RSI turning up from below 35. The initial target sits at 23,200 — the lower boundary of the prior consolidation zone — with a secondary target at 23,488 near the 200-day MA. A stop loss below 21,900 keeps the risk contained at roughly 2% of the entry price while offering a reward-to-risk ratio above 1.5:1.
Breakdown Scenario Parameters
If the DAX fails to hold 22,000 on a closing basis, the short setup targets 21,500 and then 21,000. A break below the March low with increasing volume would confirm this bearish continuation. The stop for a short position goes above 22,500, limiting risk on a false breakdown.
Why Automation Makes a Difference at Key Levels
The challenge with trading major index turning points is timing. Reversals from oversold conditions often start with violent intraday moves that are difficult to catch manually. A trading bot monitoring the DAX around the clock can execute the bounce entry the moment confirmation criteria are met — without hesitation or second-guessing.
The Trend Lines Bot is particularly effective in this environment, as it tracks moving average crossovers and trend line breaks in real time. When the DAX starts reclaiming its short-term moving averages, the bot can enter long positions automatically with pre-defined risk parameters. For traders who prefer momentum-based entries, the RSI Divergence Bot scans for bullish divergence patterns — where price makes a new low but RSI does not — which are among the most reliable reversal signals on index charts.
Before committing capital, backtesting the strategy on historical DAX data gives you an objective edge. The Indicators Tester lets you run your RSI and moving average parameters against years of DAX price action, so you can see how a bounce-trading strategy would have performed during previous corrections of similar magnitude.
Key Levels to Watch This Week
The DAX 40 is sitting at a critical inflection point. Here are the levels that matter most for the sessions ahead:
Immediate support rests at 22,000, followed by the deeper structural floor at 21,500. On the upside, first resistance arrives at 23,000 — the psychological round number and lower edge of the prior accumulation zone. Above that, 23,488 (the 200-day MA) represents the level where the recovery thesis gets its first real test. A sustained move above 24,200 would signal that the correction is over and the path back toward the January highs is open.
The ECB rate decision from March 18-19 introduced a more dovish forward guidance, and Germany's massive fiscal stimulus program continues to provide a structural tailwind. These fundamental factors support the case for a medium-term recovery, but the short-term technicals demand patience and precision.
Getting Started with the DAX Bounce Strategy
1. Open your MetaTrader 4 or 5 platform and load the DAX 40 (DE40) daily chart.
2. Add the 50-day, 100-day, and 200-day moving averages along with the 14-period RSI indicator.
3. Identify the current price position relative to the 22,000-23,000 support zone.
4. Backtest your entry and exit rules using the Indicators Tester to validate your parameters on historical corrections.
5. Deploy the Trend Lines Bot or RSI Divergence Bot to automate trade execution at your predefined levels.
6. Set your risk management rules — no more than 1-2% of account equity per trade — and let the bot handle the timing.
Trading a major index correction requires discipline, real-time execution, and a plan that removes emotion from the equation. Whether the DAX bounces from 22,380 or breaks down further, having automated tools in place means you are ready for either scenario. For questions about which setup fits your trading style, reach out through our contact page and our team will help you get configured.