DAX 40 Holds Above 23,100 Amid Rising Volatility
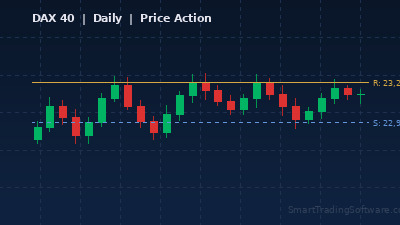
The DAX 40 index is trading around 23,125 in early April 2026, consolidating within a relatively tight band after a turbulent first quarter marked by geopolitical tensions and energy market disruptions. Today's session opened at 23,119 and has ranged between 23,095 and 23,213, reflecting the kind of compressed price action that often precedes a breakout move. With the European Central Bank maintaining its easing stance and German corporate earnings showing resilience, the index sits at a technical inflection point where price action traders can find well-defined setups.
The 14-day RSI reads 59, which places the DAX in a mildly bullish zone without being overbought, while MACD remains positive at 66.58. These indicators confirm that momentum has not yet exhausted itself, but the real edge lies in reading the candlestick patterns and key horizontal levels that have formed over recent weeks.
Price Action Strategy: Reading the DAX Structure
Price action trading strips away indicator noise and focuses on what the market is actually doing at critical levels. For the DAX at this juncture, two structural elements stand out. First, the index has built a clear consolidation range between 22,955 on the downside and 23,200 on the upside. Second, the daily candlestick patterns around these boundaries are providing tradeable signals that automated systems can exploit with precision.
A bullish engulfing pattern at the 22,955 pivot zone or a pin bar rejection off the 23,200 resistance level both represent high-probability setups. The key is waiting for the candle to close before committing to a trade, rather than anticipating the pattern mid-session. This discipline is where the Price Action Bot excels — it monitors multiple timeframes simultaneously and only triggers entries when a confirmed pattern aligns with the broader market structure.
Bullish Scenario: Break Above 23,200
If the DAX closes decisively above the 23,200 resistance level on the daily chart, this would signal a potential move toward the next resistance zone at 24,100. A confirmed breakout should be accompanied by expanding volume and ideally a retest of 23,200 as new support before continuation higher.
Entry: Buy on a daily close above 23,200 or on a pullback retest of this level with a bullish candlestick confirmation.
Stop Loss: Below the consolidation low at 22,900, giving approximately 300 points of risk.
Take Profit 1: 23,600 — a measured move target from the consolidation range.
Take Profit 2: 24,100 — the major resistance zone where sellers previously stepped in.
Bearish Scenario: Rejection at Resistance
If the DAX prints a bearish reversal pattern such as an evening star or a shooting star at the 23,200 level, this would suggest the consolidation resolves to the downside. The target in this scenario is a retest of the 22,400 support floor, with the 22,204 level serving as the deeper structural support.
Entry: Sell on a confirmed bearish reversal pattern at 23,200 on the daily or H4 timeframe.
Stop Loss: Above the candle high plus a small buffer, typically around 23,280.
Take Profit 1: 22,600 — the midpoint of the expected move.
Take Profit 2: 22,400 — the established support floor from late March.
Why Automation Gives You the Edge on DAX Price Action
The challenge with price action trading is not the strategy itself — it is the execution. Watching multiple timeframes across European trading hours, waiting for candle closes, and managing positions without emotional interference demands a level of consistency that manual traders struggle to maintain. The DAX opens at 09:00 CET and its most volatile periods often coincide with US market overlaps in the afternoon, meaning traders need to stay alert for hours.
Automated trading systems eliminate this burden entirely. The Price Action Bot scans for over a dozen candlestick patterns across your chosen timeframes and instruments, entering trades only when pattern confirmation meets your predefined risk parameters. Combined with the Moving Average Distance Indicator, you can add a trend filter that ensures price action signals are only taken in the direction of the prevailing trend — avoiding counter-trend traps that cost money in choppy markets like the current DAX environment.
Key DAX Levels to Watch This Week
The following levels are derived from recent price structure and represent the zones where institutional order flow is most likely to concentrate:
Resistance levels: 23,200 (immediate ceiling and breakout trigger), 23,600 (measured move target), 24,100 (major resistance from the March highs).
Support levels: 22,955 (pivot and near-term support), 22,400 (structural support floor), 22,204 (deep support and March low area), 21,707 (major structural support if broader sell-off resumes).
The 22,955 pivot is the line in the sand for near-term direction. As long as the DAX holds above this level on a closing basis, the bullish scenario remains in play. A break below it shifts the bias toward testing the 22,400 floor, and traders should adjust their strategies accordingly.
Getting Started with Automated DAX Trading
1. Open a MetaTrader 5 demo account and load the DAX 40 (DE40) chart on the daily and H4 timeframes to familiarize yourself with the current price structure.
2. Install the Price Action Bot and configure it for the DAX with the breakout and reversal parameters outlined above. Start with conservative position sizing on a demo account.
3. Add the Moving Average Distance Indicator as a trend filter to ensure your price action setups align with the broader directional bias.
4. Backtest your configuration using the Indicators Tester against historical DAX data covering the last six months of volatile conditions to validate your parameters before going live.
5. Once satisfied with demo results, transition to a live account with proper risk management — never risking more than 1-2% of your capital per trade.
Have questions about which configuration suits your trading style? Our team is ready to help — get in touch and we will guide you through the setup process.