DAX 40 Drops Below 22,400: Trading the Oversold Bounce with Price Action
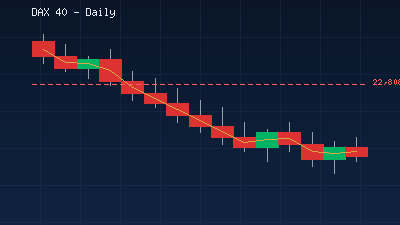
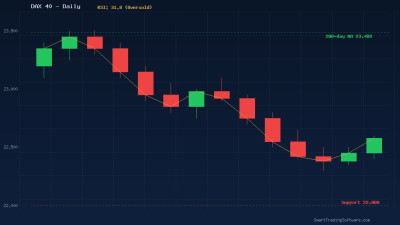
The German DAX 40 index has extended its decline this week, falling below the 22,400 mark as geopolitical tensions in the Middle East and energy supply concerns continue to pressure European equities. From its January all-time high near 25,507, the index has now shed more than 12%, marking one of the sharpest corrections among major global indices in 2026. With the RSI dipping into deeply oversold territory below 32, traders are watching closely for signs of a technical bounce from key support zones.
Losses have been broad-based, led by industrial heavyweights like Siemens Energy, Infineon, and Siemens, while defensive names such as SAP and Deutsche Boerse have shown relative resilience. The sell-off has pushed the DAX well below its 50-day and 100-day moving averages, creating a significant gap that historically tends to attract mean-reversion buyers once selling pressure subsides.
A Price Action Strategy for the DAX Recovery Trade
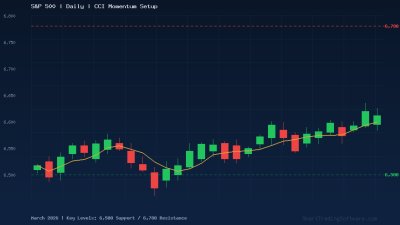
When an index falls this far this fast, the highest-probability trades often come from price action setups at well-defined support zones. Rather than trying to catch the exact bottom, experienced traders look for bullish reversal patterns — such as engulfing candles, pin bars, or inside bar breakouts — forming near key horizontal support levels. These patterns signal that buyers are stepping in with conviction, providing a clear and objective entry trigger.
Entry Conditions to Watch
The current price structure places the DAX in a critical zone between 22,000 and 22,800. The 22,808 level, which aligns with the prior swing low from the March correction, serves as the first meaningful support. Below that, the 22,300 area — where the index is currently consolidating — represents a zone where institutional buyers historically accumulate positions. Look for a daily bullish engulfing candle or a strong rejection wick off the 22,000–22,300 zone before entering a long position.
Stop Loss and Take Profit Parameters
A stop loss placed 100–150 points below the entry candle’s low keeps risk defined while giving the trade enough room to breathe through intraday volatility. On the upside, the first target sits at 23,129 — the next horizontal resistance — with a secondary target at the 23,823 pivot zone. An ambitious third target at 24,144 is where the 100-day moving average converges with previous support-turned-resistance. This layered approach offers a reward-to-risk ratio of 2:1 to 3:1 on the initial setup.
Why Automated Trading Excels in Volatile Index Markets
Index markets like the DAX present unique challenges during periods of elevated volatility. Price can gap overnight due to geopolitical developments, economic data releases, or shifts in energy prices. These rapid moves make it difficult for manual traders to execute entries and exits at optimal levels. Automated trading systems eliminate this timing problem by monitoring the market around the clock and executing trades the moment conditions are met.
The SmartTradingSoftware Price Action Bot is specifically designed for situations like the current DAX setup. It identifies reversal patterns at key support and resistance levels, enters positions automatically, and manages risk through predefined stop loss and take profit levels. For traders who prefer a trend-following approach to ride the recovery once it begins, the Trend Lines Bot uses moving average crossovers and trendline analysis to capture sustained directional moves after the initial bounce confirms.
Before deploying any strategy on a live account, backtesting is essential to validate performance across different market conditions. The Indicators Tester allows traders to simulate their strategies against years of historical DAX data, optimizing parameters like entry timing, position sizing, and exit rules to build confidence before risking real capital.
Key DAX 40 Levels to Watch This Week
Understanding the current support and resistance landscape is critical for timing entries and managing trades effectively. Here are the levels that matter most for the DAX right now:
Support Levels: The immediate support sits at 22,300, where the index is currently testing buyer interest. Below that, 22,000 represents a psychological round number with significant volume history. A breakdown below 22,000 would open the door to 21,500, though the deeply oversold RSI reading of 31.8 makes an extended decline without a bounce increasingly unlikely.
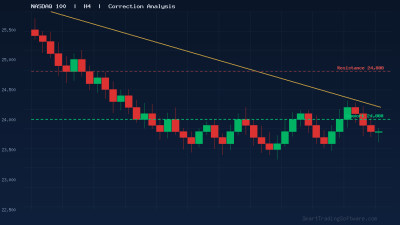
Resistance Levels: The first barrier on any recovery attempt is 23,129, followed by the pivot zone at 23,823. The 50-day moving average near 24,900 represents a major overhead level that would signal a full recovery from the current correction if reclaimed.
Germany’s €500 billion fiscal stimulus program and the ECB’s capacity to ease rates further provide fundamental tailwinds that support the case for a medium-term recovery. The key is patience and discipline — waiting for a confirmed price action signal at support rather than attempting to catch a falling knife.
Getting Started with DAX Automation
1. Open a MetaTrader 4 or MetaTrader 5 demo account with a broker that offers DAX 40 CFDs and ensure you have reliable market data.
2. Install the Price Action Bot or the Trend Lines Bot on your platform and configure it for the DAX 40 chart on the H4 or Daily timeframe.
3. Run a backtest using the Indicators Tester over at least 12 months of historical data to evaluate performance during both trending and ranging conditions.
4. Start with a demo account to verify that the bot executes trades according to your expectations in live market conditions before transitioning to real capital.
5. Monitor performance weekly and adjust parameters as needed based on evolving market dynamics and volatility levels.
For personalized guidance on setting up automated DAX trading strategies or selecting the right bot for your trading style, visit our contact page and speak with our team.