Gold Pulls Back to $4,723 Amid Strait of Hormuz Tensions
XAU/USD slipped 0.59% on Monday April 13 to trade near $4,723 per ounce, retreating from last week's highs as markets digest the latest geopolitical developments surrounding the Strait of Hormuz. Failed weekend negotiations between the US and Iran have raised concerns about potential blockade scenarios, pushing energy prices higher while creating short-term headwinds for gold as traders reassess risk allocations. Despite the pullback, the broader bullish structure remains intact with price action holding well above the 50-day moving average near $4,680.
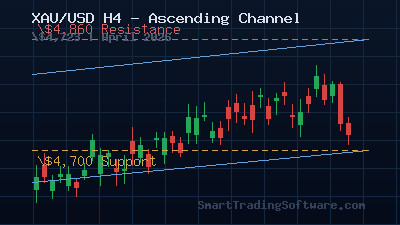
For traders looking to capitalize on this setup, the current consolidation between $4,700 support and $4,860 resistance offers a well-defined range with clear entry and exit parameters. The combination of elevated geopolitical risk, persistent inflation expectations, and central bank demand continues to underpin the yellow metal's longer-term bullish trajectory.
Trading the $4,700–4,860 Range: A Trend Line Approach
The daily chart reveals a clearly defined ascending channel that has been guiding gold's price action since early March 2026. The lower channel boundary currently aligns with support near $4,700, while the upper boundary converges with resistance around $4,850–$4,860. This channel structure provides a reliable framework for identifying high-probability entries on pullbacks to the lower trendline.
The moving average configuration supports the bullish bias. The 20-day EMA sits at approximately $4,740, with the 50-day EMA at $4,680 and the 200-day EMA well below at $4,320. This stacked alignment—price above all three averages in ascending order—is a textbook bullish trend configuration. The Trend Lines Bot is specifically designed to identify and trade these channel-bound setups automatically, drawing dynamic trendlines and executing entries when price tests the channel boundaries.
Entry Parameters for Long Positions
The primary buy zone sits between $4,700 and $4,720, where the ascending channel support converges with the psychological $4,700 round number. A secondary entry opportunity exists at $4,645, which marks the strong demand zone and the 50% Fibonacci retracement of the March–April rally. Stop-loss placement below $4,630 provides adequate protection while keeping risk-to-reward ratios favorable at roughly 1:2.5 when targeting the $4,850 resistance zone.
Exit Strategy and Profit Targets
The first take-profit level sits at $4,800, where the intermediate pivot and psychological resistance converge. A more aggressive target at $4,850–$4,860 lines up with the major resistance zone and upper channel boundary. Traders who prefer scaling out of positions can close 50% at $4,800 and trail the remainder with a stop at breakeven toward the $4,860 level. For those targeting an extended move, the $4,970 zone represents the next structural objective if the upper channel breaks convincingly.
Why Automation Makes a Difference in Gold Trading
Gold's price action is heavily influenced by sudden geopolitical developments, central bank announcements, and shifts in real yield expectations. These events often trigger sharp intraday moves that can be difficult to capture manually—especially across different time zones. The current environment, with Strait of Hormuz tensions creating unpredictable spikes, underscores the advantage of having an automated system monitoring the market around the clock.
The Gold Bot was built specifically for XAU/USD trading, incorporating volatility filters that adapt to gold's unique price characteristics. It automatically adjusts position sizing based on current ATR values, ensuring that lot sizes remain proportional to prevailing market conditions. During periods of elevated volatility like the current geopolitical backdrop, this adaptive approach helps manage risk without requiring constant manual intervention.
Additionally, pairing automated execution with the MA Distance Indicator can help confirm whether a pullback represents a genuine buying opportunity or the beginning of a deeper correction. When the distance between price and the 50-day moving average reaches historically stretched levels, it signals potential mean reversion—a valuable filter for timing channel-based entries.
Key Levels to Watch This Week
With US PPI data for March due on April 14 and the Federal Reserve's Beige Book release scheduled for April 15, gold traders should pay close attention to the following technical levels:
Support: $4,700 (ascending channel support and round number), $4,680 (50-day EMA), $4,645 (major demand zone and Fibonacci 50% retracement).
Resistance: $4,750 (immediate pivot), $4,800–$4,820 (intermediate resistance zone), $4,850–$4,860 (major resistance and upper channel boundary).
A daily close above $4,860 would signal a channel breakout and open the path toward $4,970. Conversely, a sustained break below $4,645 would invalidate the ascending channel structure and shift the near-term bias to neutral, with $4,595 as the next Fibonacci support floor.
Getting Started with Automated Gold Trading
1. Open a MetaTrader 4 or MetaTrader 5 account with a broker that offers competitive spreads on XAU/USD—ideally below 30 cents per ounce.
2. Install the Gold Bot on your platform and configure it for the H1 or H4 timeframe, which best suits the current channel-trading setup.
3. Set the bot's risk parameters to 1–2% per trade and define your preferred take-profit levels at $4,800 and $4,860.
4. Add the MA Distance Indicator to your chart to monitor trend strength and pullback depth in real time.
5. Let the system monitor the $4,700–$4,860 range and execute trades automatically while you focus on higher-level analysis.
If you have questions about configuring the Gold Bot for the current market environment or need help choosing the right parameters for your account size, feel free to reach out through our contact page.