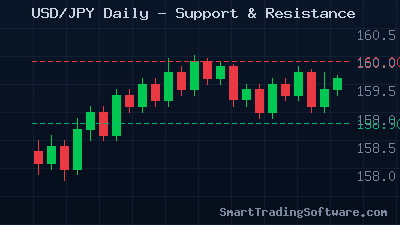
USD/JPY Tests the 160.00 Ceiling: A Critical Moment for Yen Traders
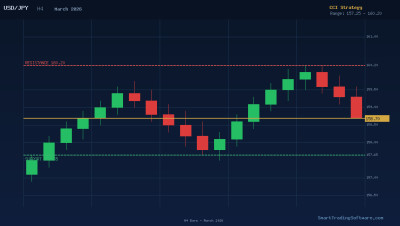
The USD/JPY pair has climbed to 159.20 as of late March 2026, pressing once again against the formidable 160.00 psychological resistance level that has capped price action repeatedly since early 2024. With the pair trading above its 50-day and 100-day simple moving averages and the 14-day RSI reading near 60, bullish momentum remains intact—but the question on every forex trader's mind is whether this ceiling will finally break or trigger another sharp rejection.
The broader macro backdrop is driving the move: the Federal Reserve's hawkish stance on interest rates continues to support dollar strength, while the Bank of Japan has been cautious with its tightening cycle. Japanese officials have previously intervened near these levels, making the 159–160 zone a high-volatility battleground that demands disciplined risk management and precise trade execution.
Trading the 160.00 Resistance: Breakout vs. Rejection Setup
The 160.00 level represents a two-year ceiling for USD/JPY. Since January 2024, the pair has oscillated within a wide 140–160 range, and every test of the upper boundary has attracted selling pressure—often amplified by BOJ intervention rhetoric. This creates two actionable scenarios for traders.
Bullish Breakout Strategy
A confirmed daily close above 160.20 would signal a significant breakout from the two-year range. In this scenario, initial targets sit at 161.50 and 163.00, with the ascending channel projection pointing toward 164.00 over the medium term. A stop-loss placed below 158.80 offers a well-defined risk of approximately 140 pips against a potential reward of 280–380 pips.
Bearish Rejection Strategy
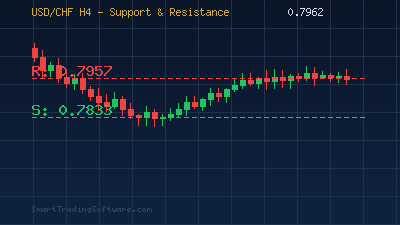
If price stalls at 160.00 and prints reversal candlestick patterns—such as a bearish engulfing or shooting star on the H4 or daily chart—a short position targeting the 157.00 support zone becomes attractive. The stop-loss above 160.50 keeps risk tight at roughly 100–130 pips, with 200+ pips of downside potential to the 157.00–157.80 support cluster.
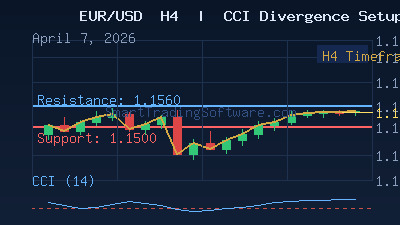
Why RSI Divergence Matters at This Level
One of the most reliable signals at major resistance zones is RSI divergence. When price pushes to new highs but the RSI fails to confirm with a corresponding new high, it warns that buying momentum is fading. At the 160.00 level, watching for bearish RSI divergence on the H4 and daily timeframes can provide early warning of a rejection before it happens.
The RSI Divergence Bot automates exactly this kind of analysis. It scans for divergence patterns across multiple pairs and timeframes simultaneously, entering trades when the divergence signal aligns with key support and resistance zones—removing the emotional hesitation that often causes traders to miss these setups.
Multi-Timeframe Confirmation for Higher Accuracy
Trading a major level like 160.00 benefits enormously from multi-timeframe analysis. A rejection on the H1 chart means little if the daily and weekly charts show strong bullish continuation. Conversely, if the weekly RSI is overbought while the daily shows divergence, the probability of a meaningful pullback increases substantially.
The RSI Multi-Timeframe Bot is purpose-built for this approach. It evaluates RSI conditions across H1, H4, and daily timeframes before taking a position, ensuring that entries align with the broader trend rather than fighting it. For USD/JPY at these elevated levels, this multi-timeframe filter can be the difference between catching a 200-pip reversal and getting stopped out on a false signal.
Key Levels to Watch This Week
The technical picture for USD/JPY is defined by a clear set of levels. On the upside, 160.00 remains the primary resistance, with 160.20 acting as the breakout confirmation level and 161.50 as the first target above. On the downside, 158.90 serves as immediate support from recent price action, 157.70–157.80 marks a stronger support cluster, and 157.00 represents the key corrective target where buyers are likely to step in aggressively.
The 200-day moving average sits well below at 151.70, confirming that the long-term uptrend remains firmly intact. Any pullback toward the 157 area would represent a buying opportunity within the broader bullish structure, particularly if confirmed by RSI readings entering oversold territory on lower timeframes.
Automating Your USD/JPY Strategy
Markets at major psychological levels like 160.00 can move fast—especially if BOJ intervention headlines hit during Asian trading hours. Having an automated system in place ensures you don't miss the breakout or the reversal while you're away from the screen. Here's how to get started:
1. Identify your bias: Review the daily chart and determine whether you're positioned for a breakout above 160.20 or a rejection back to 157.00.
2. Set your parameters: Configure entry triggers, stop-loss levels, and take-profit targets based on the key levels outlined above.
3. Deploy automation: Use the RSI Divergence Bot or RSI Multi-Timeframe Bot on MetaTrader 4/5 to execute your plan 24/5 without manual intervention.
4. Backtest first: Validate your setup against historical data using the RSI Multi-Timeframe Tester to confirm the strategy performs well at similar resistance levels.
The 160.00 level in USD/JPY won't stay untested for long. Whether it breaks or holds, having a clear plan and the automation to execute it gives you the edge. Have questions about configuring these tools for your trading style? Reach out to our team for personalized guidance.