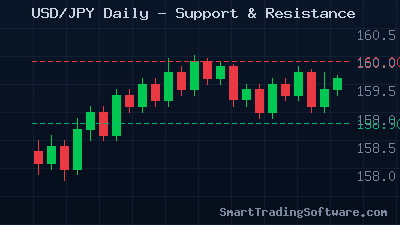
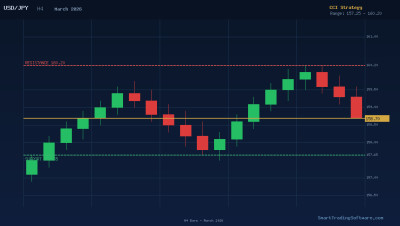
The USD/JPY pair is trading near 159.33 as of mid-April 2026, sitting just below the critical 160.00 psychological resistance level. After weeks of climbing within an ascending channel, the pair is now testing a zone that has historically triggered intervention threats from Japanese authorities. For traders using MetaTrader 4 or MetaTrader 5, this creates an ideal environment for a support and resistance breakout strategy backed by automated execution.
USD/JPY Market Overview: Testing the 160 Ceiling
The dollar-yen pair has been posting higher lows and higher highs since early March, rising from the 155.80 area to the current 159.33 level. The ascending channel remains intact on the daily chart, with the lower boundary near 158.40 and the upper boundary approaching 160.90. The weekly chart continues to flash bullish signals, with the 50-day moving average trending above the 200-day moving average in a confirmed golden cross pattern.
However, the 160.00 level carries significant weight. Japanese officials have repeatedly warned against excessive yen weakness, and traders remember the direct intervention campaigns of 2022 and 2024. This creates a natural resistance cap that makes the zone between 159.00 and 161.00 a high-probability trading area for range-bound and breakout strategies alike.
Support and Resistance Breakout Strategy for USD/JPY
The current setup offers two clear scenarios. A sustained break above 160.00 with a daily close confirmation opens the path toward 160.90 and potentially 162.00. Conversely, a rejection at 160.00 would likely send the pair back toward 158.90 support, with a deeper pullback targeting 158.40 at the channel bottom.
Long Entry Parameters
Wait for a daily close above 160.10 to confirm the breakout. Enter on the pullback to the 160.00 level, which should now act as support. Set the stop loss at 159.40, below the nearest swing low. The first take profit target sits at 160.90, the channel top, with a second target at 162.00 for a risk-to-reward ratio of approximately 1:2.5.
Short Entry Parameters
If the pair prints a bearish engulfing candle or a pin bar rejection at 160.00 on the H4 or daily chart, enter short with a stop loss at 160.50. Target 158.90 as the first take profit level and 158.40 as the extended target. This trade benefits from the intervention risk premium that naturally caps upside momentum near the 160 handle.
RSI Multi-Timeframe Confirmation
Before entering either trade, check the RSI across the H1, H4, and Daily timeframes. For a long breakout, all three RSI readings should be above 50 but below 70 to confirm momentum without overbought conditions. For the short rejection trade, look for RSI divergence on the H4 chart where price makes a new high near 160 but RSI prints a lower high. The RSI Multi-Timeframe Tester allows you to backtest this exact confluence setup across years of historical data before committing real capital.
Why Automated Trading Matters at Key Psychological Levels
The 160.00 level on USD/JPY is precisely the type of zone where manual trading becomes difficult. Price can spike through the level on a news release, trigger stops, and reverse within minutes, especially if intervention headlines hit the wires. An automated approach removes the emotional component and executes the predefined plan without hesitation.
The Support and Resistance Bot is designed for exactly this scenario. It automatically identifies key horizontal levels, monitors for breakouts or rejections, and executes trades with precise stop loss and take profit placement. When paired with the current USD/JPY setup, it can watch the 160.00 level around the clock and enter the moment your criteria are met.
For traders who want additional indicator-based confirmation, the RSI Multi-Timeframe Bot adds a layer of RSI confluence analysis across multiple chart periods, filtering out false breakouts that often occur at round-number levels.
Key Levels to Watch This Week
The immediate resistance zone sits at 160.00 to 160.10, the psychological barrier and the level where intervention fears intensify. Above that, 160.90 marks the ascending channel top on the daily chart, while 162.00 represents the next structural resistance from the 2024 highs. On the downside, 158.90 serves as the first meaningful support where buyers have stepped in during recent pullbacks. A break below 158.40, the channel bottom, would shift the short-term bias to bearish and expose 157.70 as the next support target.
Getting Started with This Strategy
1. Open the USD/JPY daily and H4 charts on MetaTrader and mark the 160.00, 158.90, and 158.40 levels.
2. Backtest your breakout and rejection criteria using the RSI Multi-Timeframe Tester to validate performance on historical data around similar key levels.
3. Install the Support and Resistance Bot on your live or demo account and configure the 160.00 zone as your primary watch level.
4. Set your risk parameters to no more than 1-2% of account equity per trade and let the bot monitor the level continuously.
5. Review trade results weekly and adjust parameters based on evolving market conditions.
Have questions about configuring the bot for USD/JPY or need help with multi-timeframe RSI settings? Reach out through our contact page and our team will help you optimize the setup for your trading style.