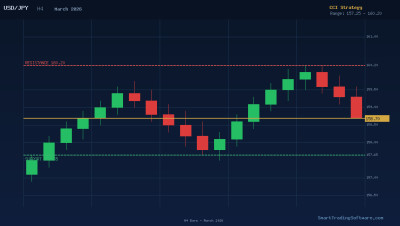
USD/JPY at 158.70: BOJ-Fed Divergence Sets Up a Classic CCI Trade
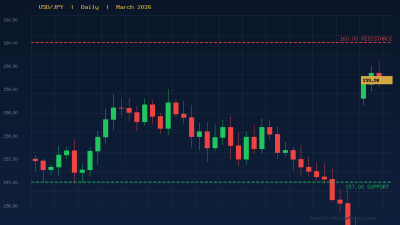
The USD/JPY pair is trading around 158.70 as of late March 2026, having oscillated within a tight 157.05–159.75 range throughout the month. Behind this consolidation lies a fascinating macro story: the Bank of Japan continues its cautious tightening cycle while the Federal Reserve has already delivered a series of rate cuts, bringing the Fed Funds rate down to roughly 3.50–3.75%. The resulting interest-rate divergence keeps the dollar elevated against the yen — but it also creates recurring oscillations between clearly defined support and resistance zones, making USD/JPY one of the most technically tradable pairs in the current environment.
For systematic traders, that kind of reliable oscillation is an opportunity. When price has been bouncing between 157.25 and 160.20 for weeks, a rules-based indicator like the Commodity Channel Index (CCI) gives you an objective way to time entries and exits — without sitting glued to a screen waiting for the next swing to develop.
The CCI Strategy for USD/JPY Range Conditions
The CCI measures how far price has moved from its average over a set period, expressed in standard deviations. Readings above +100 signal that price is overextended to the upside; readings below -100 indicate oversold conditions. In a ranging market like the current USD/JPY structure, these extremes often coincide with short-term reversals from key support and resistance levels — giving traders two clear triggers per swing rather than one.
The setup on USD/JPY right now is textbook: price has been finding consistent buyers in the 157.25–157.65 support zone, with CCI typically printing below -100 near those lows. Sellers step in around the 160.20 resistance, where CCI tends to spike above +100. A straightforward mean-reversion approach — buy the oversold dip near support, sell into the overbought rally near resistance — has been quietly generating clean setups all month.
Trade Entry Parameters
For long entries, look for price to pull back into the 157.25–157.65 zone while the CCI(20) reading drops below -100 on the H4 chart. Confirmation comes when CCI crosses back above -100 on the following candle — that crossover signals that selling pressure is exhausting and momentum is rotating. Wait for the full candle close above the crossover level before entering to reduce false signals.
For short entries, the mirror setup applies: price approaches the 160.00–160.20 zone, CCI(20) rises above +100, then crosses back below +100 on the close. The sequence of spike above, then return filters out momentum-driven breakouts and keeps you on the right side of the range.
Stop-Loss and Take-Profit Levels
Stop losses for long trades should sit comfortably below the 156.85 level — the line in the sand where a deeper breakdown becomes likely and the range thesis is invalidated. That gives roughly 40–80 pips of breathing room from the entry zone, which is appropriate for H4 trades on this pair.
Take-profit targets for long trades are positioned at 159.50 (mid-range, partial close) and 160.20 (range top, full exit). For short trades, the initial target is 158.00 with a full exit near 157.40. A 1:1.5 to 1:2 risk-reward ratio is achievable with disciplined execution, particularly if you trail the stop once the trade is halfway to target.
Timeframe and Confirmation Filters
The H4 timeframe is the sweet spot for this strategy — it captures enough intraday structure without generating excessive noise. Adding a daily trend filter strengthens the setup: if the daily chart shows USD/JPY trading above its 20-day moving average (currently near 158.20), prioritise long setups and be more selective with shorts; vice versa when price falls below the daily MA.
Volume spikes around the Tokyo and London opens often precede sharp moves in USD/JPY. Avoid entering CCI signals in the 30 minutes immediately before or after major Japanese or US data releases (CPI, NFP, BOJ rate decisions), as these events can invalidate the range structure in a single candle.
Why Automated Trading Fits This Setup Perfectly
The challenge with range trading is psychological: after a few losses near obvious levels, it becomes tempting to skip the next signal — which is often the cleanest one. Manual traders frequently experience this kind of selective execution that erodes the statistical edge of a sound strategy. An automated approach removes that human variable entirely.
The CCI Bot from SmartTradingSoftware is designed precisely for this type of setup. It monitors the CCI indicator in real time on your chosen timeframe, triggers entries on confirmed crossovers, and manages stop-loss and take-profit levels automatically. You define the parameters — period, overbought/oversold thresholds, lot size, SL/TP distances — and the bot executes with zero hesitation on every qualifying signal, day or night, without any intervention needed from you.
For traders who want to dig deeper into how the CCI performs on USD/JPY specifically, the Indicators Tester lets you run the CCI strategy over years of historical data to validate the thresholds and timeframe settings before risking real capital. Testing different CCI periods (14, 20, 30) and overbought/oversold levels (plus or minus 100 vs plus or minus 150) across various market regimes — trending, ranging, volatile — gives you objective evidence about which configuration fits USD/JPY best.
If the CCI signals alone feel insufficient, the RSI Divergence Bot adds another dimension: it identifies bullish and bearish divergences between price and the RSI, often appearing at the same support/resistance zones where CCI is giving its reversal signal. Running both filters together can significantly improve entry quality, particularly during volatile periods around central bank announcements.
Key Levels to Watch This Week
With the BOJ's next policy meeting approaching and US PCE inflation data due before month-end, USD/JPY is unlikely to break decisively out of its current range without a clear catalyst. Until that catalyst arrives, the technical structure remains well-defined.
Support levels: 157.65 (first support, recent bounce zone), 157.25 (stronger structural support), 156.85 (invalidation level — a break below here signals a potential drop toward 155.50).
Resistance levels: 159.75 (March swing high), 160.20 (key resistance — a break and hold above this level opens the door to 161.85–161.95), 162.00 (psychological round number with prior significance).
A sustained daily close above 160.20 would shift the technical picture from range to breakout mode and would make short-side CCI setups far less attractive. Watch daily candle closes carefully around that level — a convincing break on elevated volume would suggest the Fed-BOJ divergence theme is reasserting itself more forcefully, at which point trending strategies become more appropriate than mean reversion.
On the downside, a break below 156.85 — perhaps triggered by a surprise BOJ policy signal or weaker-than-expected US data — could accelerate yen strength toward the 155.00 area. In that scenario, range-trading assumptions need to be revisited quickly.
Getting Started with an Automated CCI Strategy on USD/JPY
Setting up a systematic CCI-based approach to USD/JPY on MetaTrader is straightforward with the right tools in place.
- Download and install the CCI Bot from the product page. The Expert Advisor works with both MetaTrader 4 and MetaTrader 5.
- Back-test your settings using the Indicators Tester. Run the CCI(20) plus or minus 100 configuration over at least 12 months of USD/JPY H4 data to understand expected drawdown and win rate before going live.
- Set your parameters to match the current range: SL near 156.85 for long trades (approximately 80–90 pips), TP at 159.50 for the first target and 160.20 for the second. Size your position so the stop-loss amount represents no more than 1–2% of account balance per trade.
- Enable the bot on your H4 USD/JPY chart and confirm it has live trading permissions in MetaTrader. Monitor the first few signals manually to verify execution matches your expectations.
- Review performance weekly and adjust if BOJ or Fed communications meaningfully shift the pair's volatility profile or average daily range.
Questions about configuration or which product best fits your trading approach? Visit the SmartTradingSoftware contact page — the team is happy to help you match the right automation tools to your specific market setup.