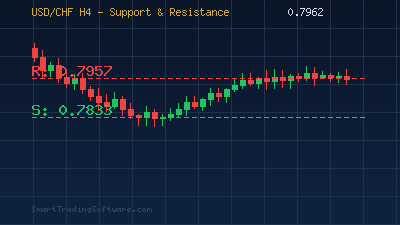
USD/CHF at 0.7962: Trading the Oversold Bounce with Support and Resistance
The USD/CHF pair is trading near 0.7962 as the last week of March 2026 begins, rebounding from the 0.7833 support zone that held firm during mid-month selling pressure. With the 14-period RSI dipping to 28.91 on the daily chart — well into oversold territory — momentum traders are watching closely for a continuation of the corrective rally toward the 0.7957–0.8000 resistance band. The broader downtrend from the September 2025 high of 0.9200 remains intact, but the current bounce from the 0.7603 cycle low is gaining traction as the dollar finds some footing against the Swiss franc.
The Swiss National Bank's decision to hold rates steady at its March policy meeting, combined with fading safe-haven demand as equity markets stabilize, has given the pair room to recover. Meanwhile, the U.S. dollar index has steadied after weeks of decline, supported by resilient labor market data and the Federal Reserve's commitment to keeping rates higher for longer. This backdrop creates a well-defined range-trading opportunity between established support and resistance levels.
Trading the USD/CHF Range with a Support and Resistance Strategy
The current price action on USD/CHF offers a textbook support-and-resistance setup. The pair has carved out a clear consolidation zone between the 0.7833 floor and the 0.7957–0.8000 ceiling over the past two weeks. Traders who use horizontal level identification can take advantage of this structured price behavior rather than trying to predict the next directional breakout.
Entry and Exit Parameters
For a long entry off support, look for price to retrace toward the 0.7850–0.7870 zone with a bullish candlestick confirmation on the H4 or daily timeframe. Place the stop loss 25–30 pips below the 0.7833 swing low, around 0.7800, to protect against a breakdown toward the 0.7603 cycle bottom. The first take-profit target sits at 0.7957 — the immediate resistance — with a secondary target at 0.8000, the psychologically significant round number. This setup offers an approximate risk-to-reward ratio of 1:2.5.
For traders eyeing the breakout scenario, a sustained close above 0.7957 on the daily chart would open the path toward 0.8213, the 38.2% Fibonacci retracement of the full 0.9200–0.7603 decline. A breakout entry above 0.7975 with a stop at 0.7920 and target at 0.8200 provides a favorable 1:4 reward profile on the larger swing.
Confirmation with RSI Multi-Timeframe Analysis
With the daily RSI at 28.91, the oversold reading supports the case for a mean-reversion bounce. Aligning this with the H4 and weekly RSI readings creates a more reliable signal. When the daily RSI is oversold while the weekly RSI is turning higher from the 35–40 zone, the probability of a sustained recovery increases significantly. The RSI Multi-Time Frame Tester lets you backtest exactly this kind of multi-timeframe divergence setup across historical data to validate the edge before committing capital.
Why Automation Gives You the Edge on USD/CHF
Support-and-resistance trading on USD/CHF demands precision timing — the pair often retests levels during the Asian or early European session when most retail traders are away from their screens. An automated approach eliminates the need to sit and wait for price to reach your predefined level, and it removes the emotional temptation to enter prematurely or move stops during volatile SNB-related headlines.
The Support and Resistance Bot is built specifically for this style of trading. It automatically identifies key horizontal levels on your chosen timeframe, places pending orders at optimal distances from those levels, and manages the trade from entry through to exit. Combined with the MA Distance Indicator, which measures how far price has stretched from its moving average, you can filter out low-probability bounce trades when price is already near its mean and focus on the high-probability setups where price has extended significantly from the average — exactly the condition we see now on USD/CHF.
Key Levels to Watch This Week
The immediate structure on USD/CHF is well defined. On the support side, 0.7833 is the critical floor — a daily close below this level would negate the bounce thesis and reopen the path toward the 0.7603 low from earlier in March. Below that, the next meaningful support cluster sits around 0.7500, a level not tested since 2015. On the upside, 0.7957 is the first hurdle, followed by the psychological 0.8000 mark. A decisive break above both levels targets 0.8213 (the 38.2% Fibonacci retracement) and eventually 0.8400, the 50% retracement of the broader decline. The ADX reading at 53.79 confirms the trend remains strong, so counter-trend longs should be managed with tight risk parameters and clear invalidation points.
Getting Started with Automated USD/CHF Trading
1. Open a MetaTrader 4 or MetaTrader 5 demo account and load the USD/CHF H4 chart to visualize the current range between 0.7833 and 0.7957.
2. Install the Support and Resistance Indicator to automatically plot the key horizontal levels discussed above, removing guesswork from level identification.
3. Backtest your bounce strategy using the Indicators Tester on at least 12 months of USD/CHF data to verify how well the 0.7833 support zone has held historically and what win rates the setup produces.
4. Once validated, deploy the Support and Resistance Bot on your live or demo account with the entry, stop-loss, and take-profit parameters outlined above.
5. Monitor performance weekly and adjust parameters as the range evolves — support-and-resistance levels shift over time, and staying aligned with the current structure is essential for consistent results.
If you have questions about configuring any of these tools for your USD/CHF trading setup, reach out through our contact page — our team is happy to help you get started.